
2023 Toyota Prius vs 2015 Tesla Model X
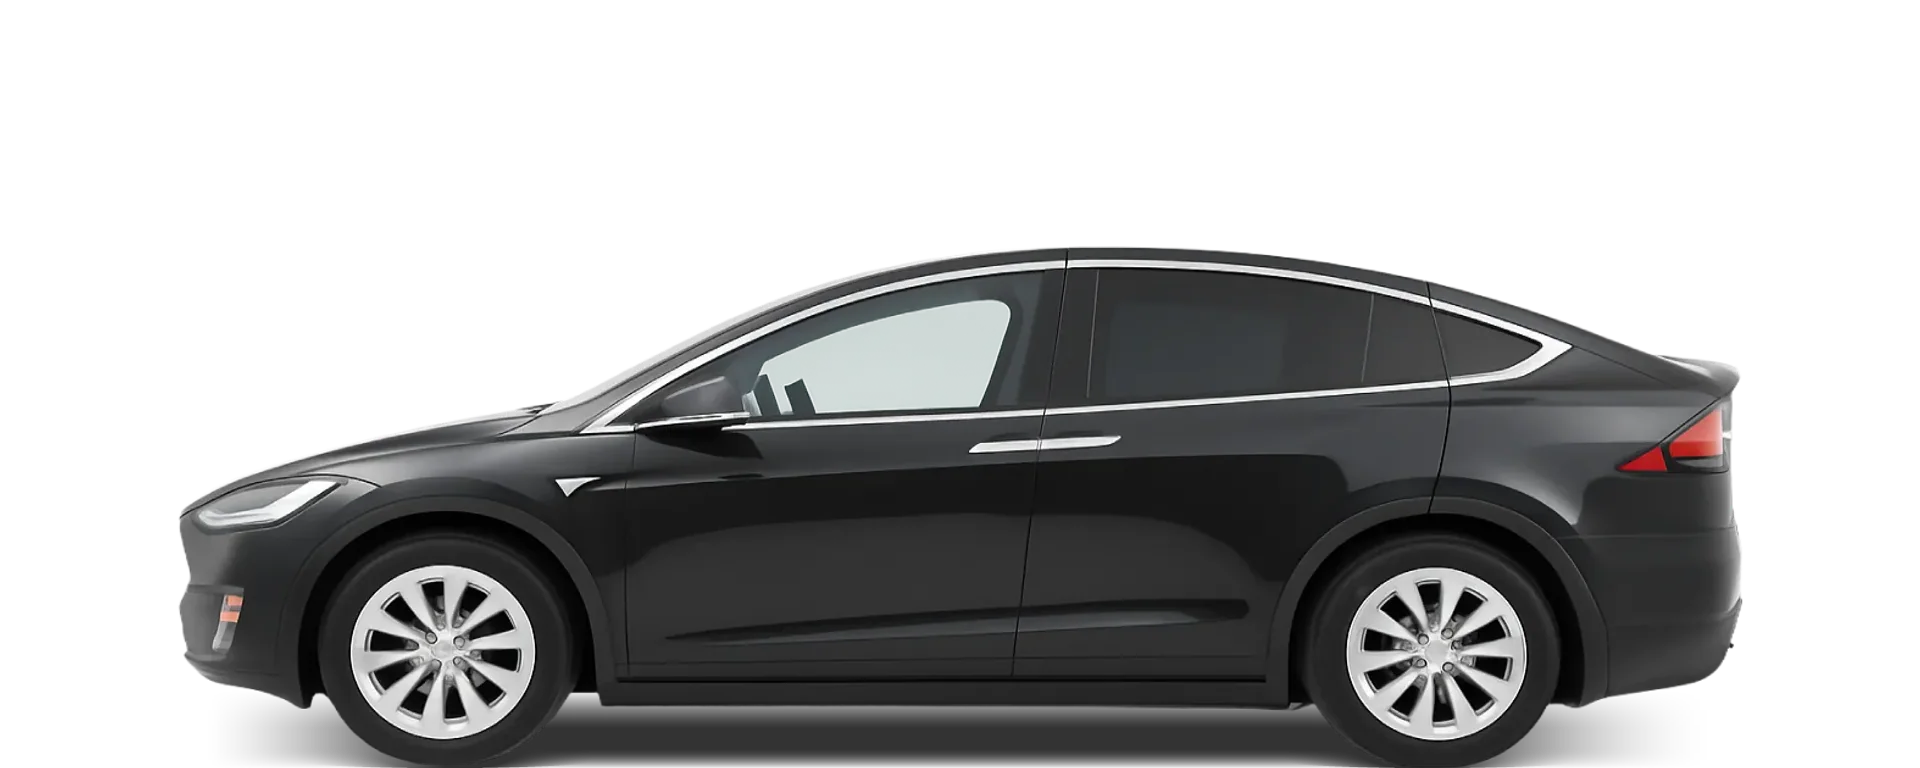
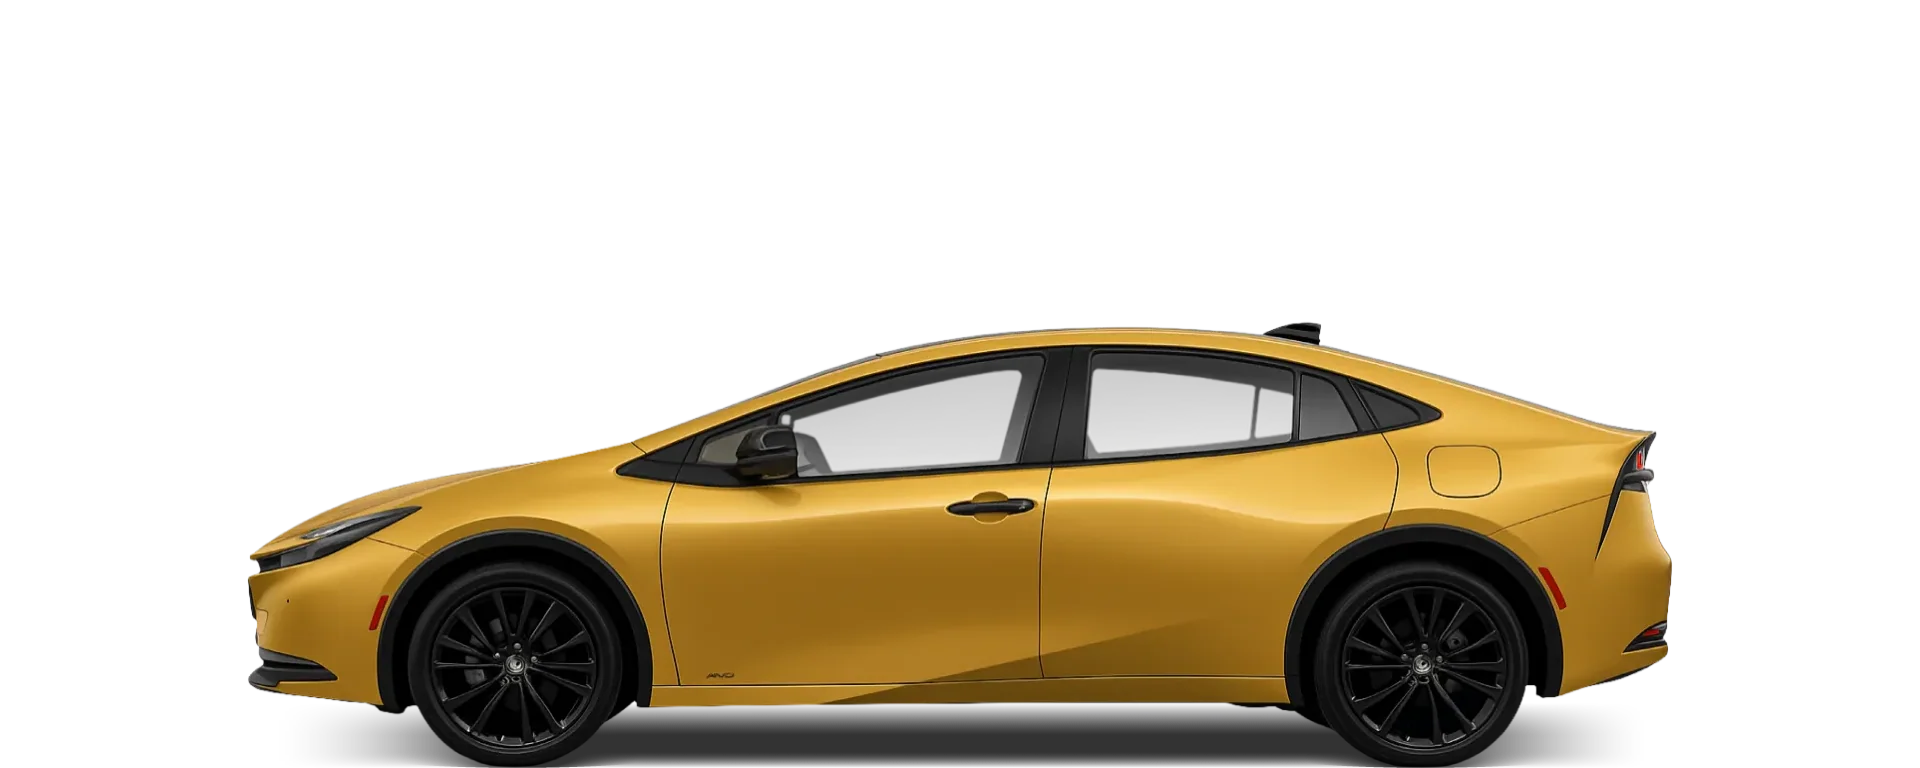
Which is bigger, the 2023 Toyota Prius or 2015 Tesla Model X?
Key dimensions: length, width, height
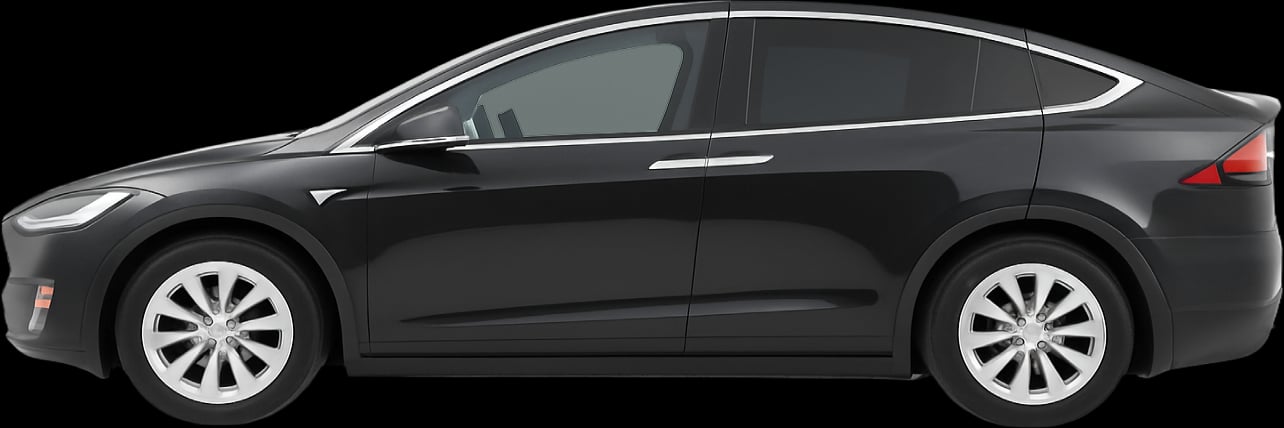
The length difference totals 45.3 cm, clearly separating the 2015 Tesla Model X and 2023 Toyota Prius. At 21.7 cm wider, the 2015 Tesla Model X belongs to a completely different size class, offering a potential level of shoulder room the 2023 Toyota Prius can't match. The difference in height is dramatic, with the 2015 Tesla Model X standing 26.4 cm taller than the 2023 Toyota Prius. The 3.4 cm increase in ground clearance from the 2015 Tesla Model X is just enough to make a positive difference on a gravel driveway vs the 2023 Toyota Prius. The 2015 Tesla Model X has a 21.5 cm longer wheelbase, which often translates to extra "stretch-out" room in the back.
Measurements
Length
459.9 cm
505.2 cm (+45.3)
Height
142 cm
168.4 cm (+26.4)
Body width
178.2 cm
199.9 cm (+21.7)
Width including mirrors
N/A
227.1 cm
Ground clearance
13.7 cm
17.1 cm (+3.4)
Wheelbase
275 cm
296.5 cm (+21.5)
Footprint
DriveSize footprint is overall length multiplied by body width.
8.2 m²
10.1 m² (+1.9)
How each car compares with its class average
Length
459.9 cm
44.7 cm longer than the average Hatchback
505.2 cm
52.6 cm longer than the average Crossover
Height
142 cm
5.9 cm shorter than the average Hatchback
168.4 cm
5.6 cm taller than the average Crossover
Body width
178.2 cm
1.7 cm wider than the average Hatchback
199.9 cm
15 cm wider than the average Crossover
Width including mirrors
N/A
227.1 cm
20.7 cm wider than the average Crossover
Ground clearance
13.7 cm
0.2 cm less ground clearance than the average Hatchback
17.1 cm
1 cm less ground clearance than the average Crossover
Wheelbase
275 cm
15.9 cm longer wheelbase than the average Hatchback
296.5 cm
24.1 cm longer wheelbase than the average Crossover
Footprint
DriveSize footprint is overall length multiplied by body width.
8.2 m²
0.9 m² larger footprint than the average Hatchback
10.1 m²
1.7 m² larger footprint than the average Crossover
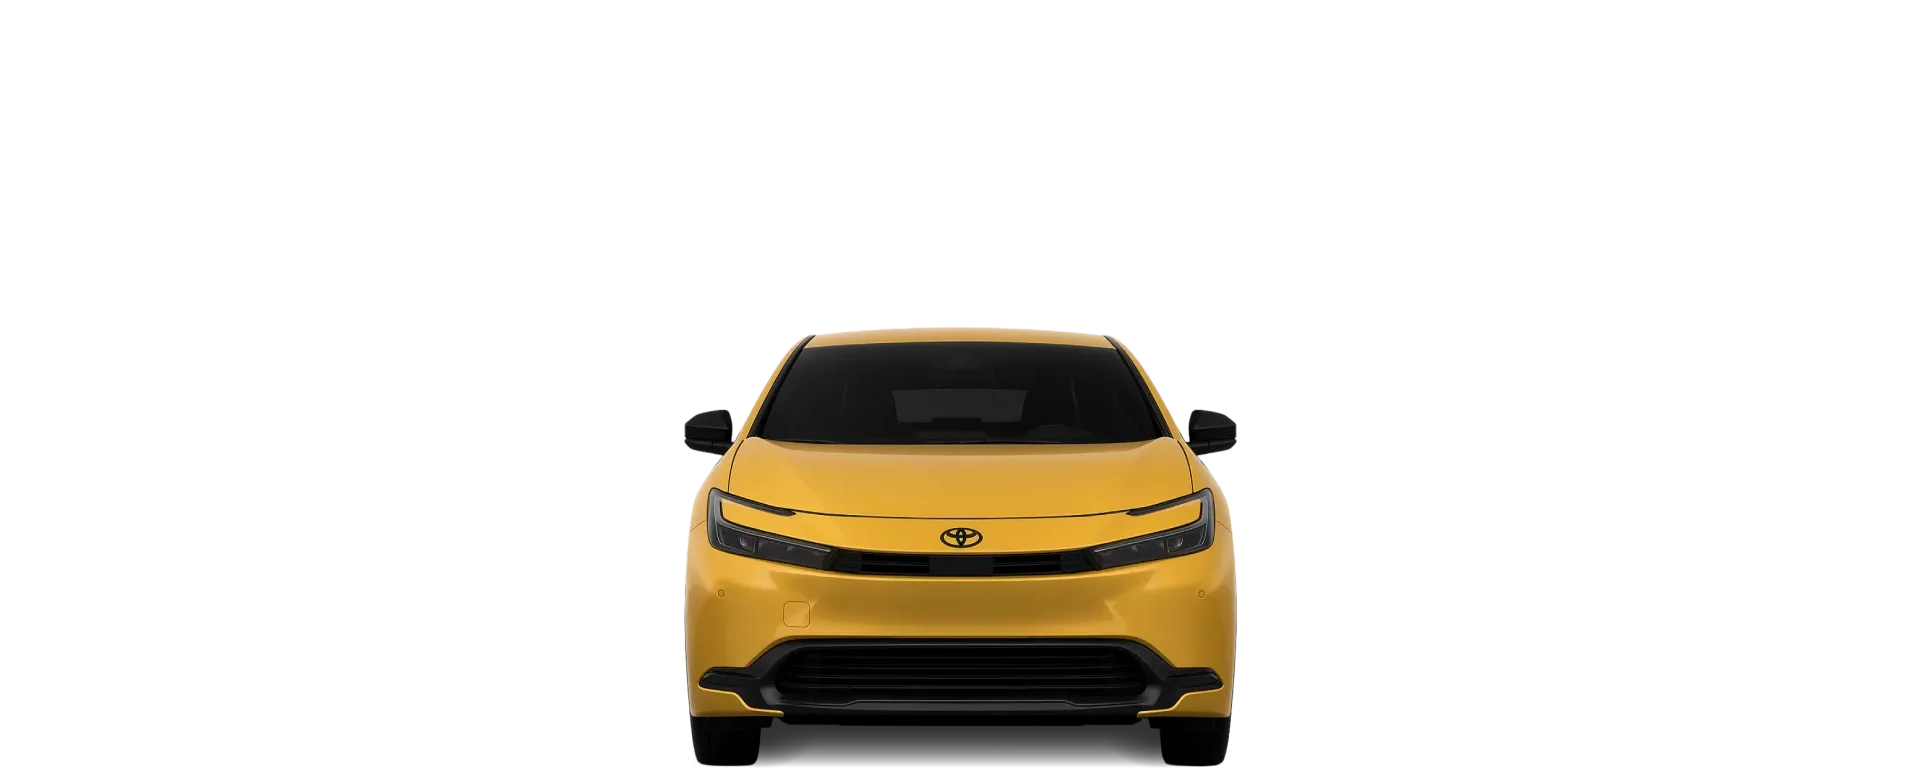
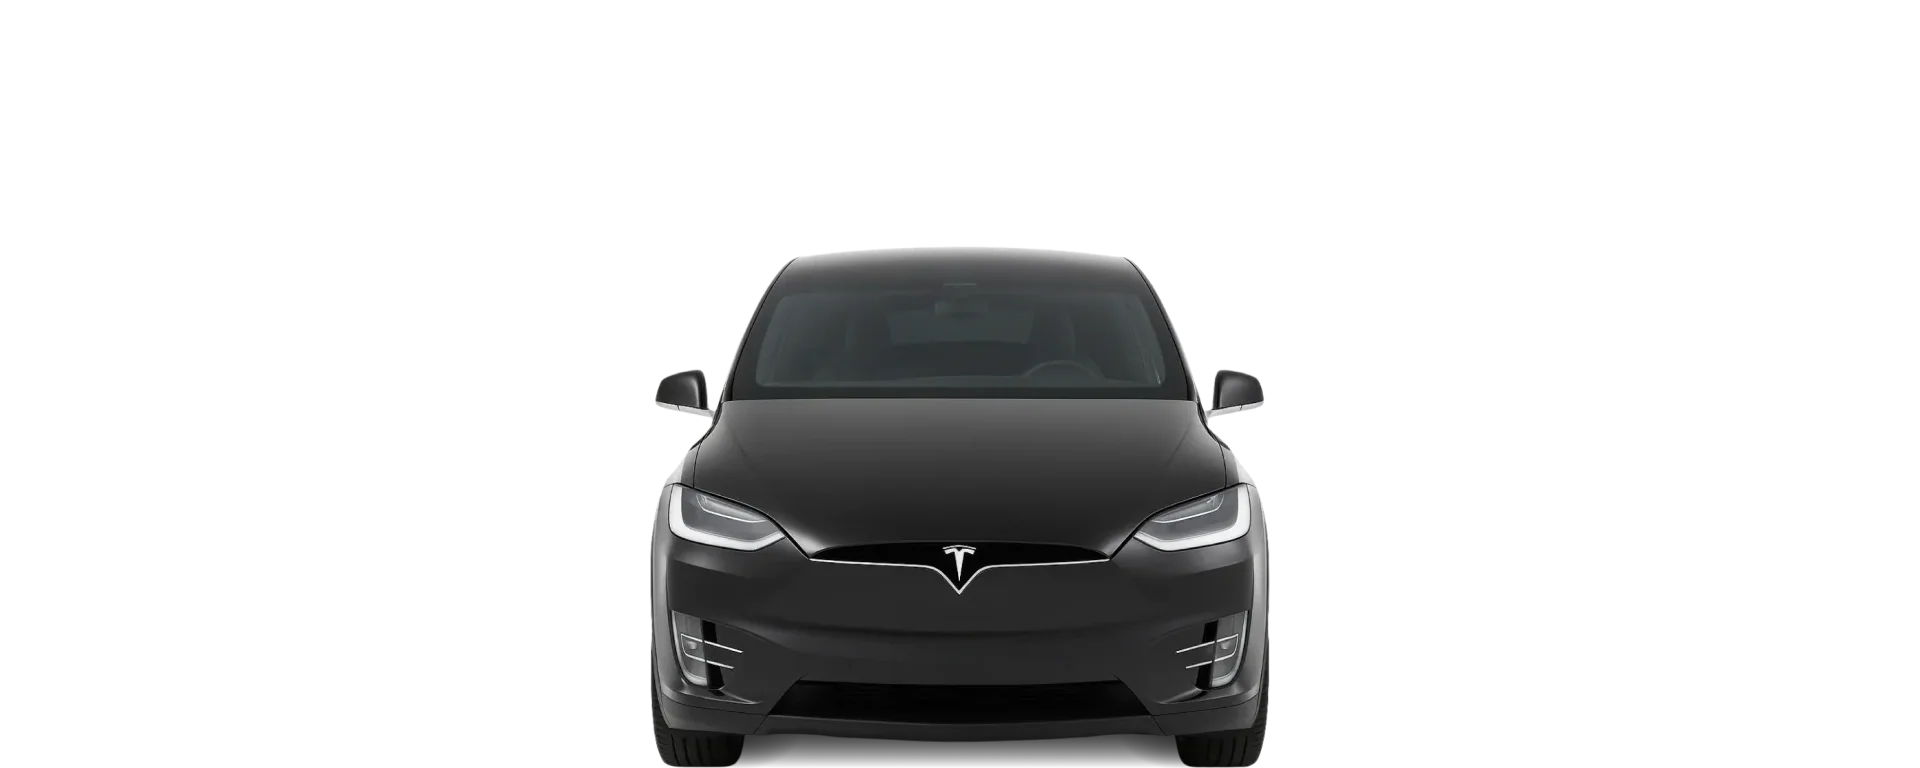
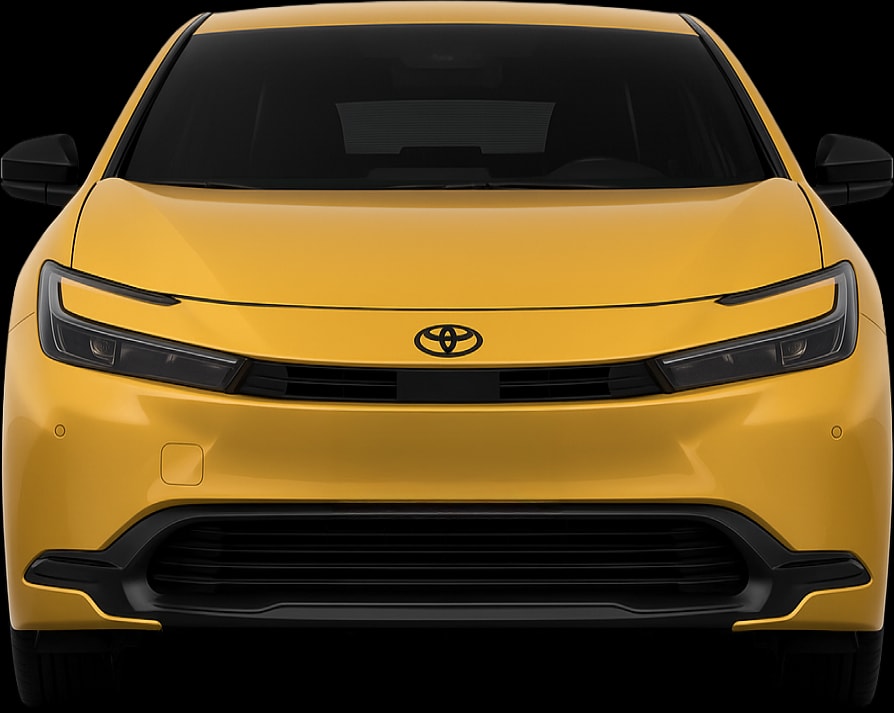
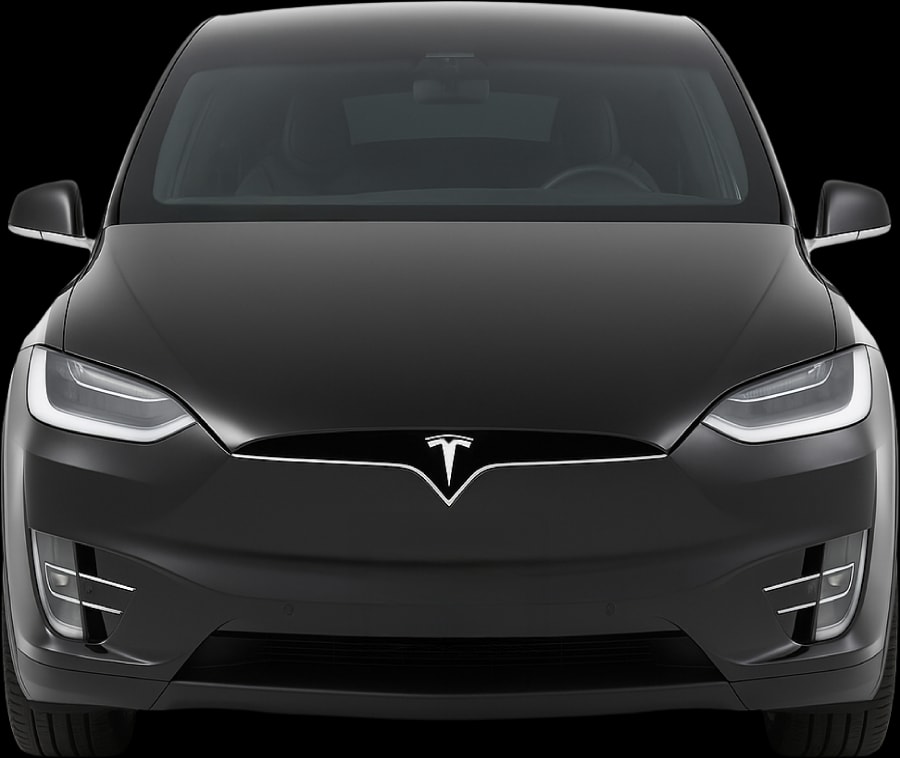
Front view
Cargo Capacity: which has more space?
Standard and largest cargo capacity
The 2023 Toyota Prius’s boot space advantage with the seats up is massive, offering 674 L against the 357 L (SAE) in the 2015 Tesla Model X. With the rear seats down, the 2015 Tesla Model X provides 2,166 L of space when using the SAE measurement method, which is way above average for crossover.
Measurements
Standard cargo capacity (VDA)
The standard cargo capacity using VDA, the method commonly used globally.
This is the manufacturer's normal published figure; it does not imply a particular seat configuration.
284 L
N/A
Standard cargo capacity (SAE)
The standard cargo capacity using SAE, the method commonly used in the US.
This is the manufacturer's normal published figure; it does not imply a particular seat configuration.
674 L (+317)
357 L
Largest cargo capacity (SAE)
The largest cargo capacity using SAE, the method commonly used in the US.
If only one SAE figure is published, the standard and largest values are the same.
N/A
2,166 L
Frunk capacity
N/A
187 L
Cargo space vs length
This DriveSize metric divides blended cargo volume by overall vehicle length.
Blended cargo uses 65% of the standard figure and 35% of the largest figure, using VDA where available and SAE otherwise.
N/A
196 L per m
Cargo space vs footprint
This DriveSize metric divides blended cargo volume by footprint.
Blended cargo uses 65% of the standard figure and 35% of the largest figure, using VDA where available and SAE otherwise.
It helps show how efficiently a car turns exterior area into usable cargo space.
N/A
98 L per m²
How each car compares with its class average
Standard cargo capacity (VDA)
The standard cargo capacity using VDA, the method commonly used globally.
This is the manufacturer's normal published figure; it does not imply a particular seat configuration.
284 L
59 L less cargo volume than the average Hatchback
N/A
Standard cargo capacity (SAE)
The standard cargo capacity using SAE, the method commonly used in the US.
This is the manufacturer's normal published figure; it does not imply a particular seat configuration.
674 L
149 L more cargo volume than the average Hatchback
357 L
382 L less cargo volume than the average Crossover
Largest cargo capacity (SAE)
The largest cargo capacity using SAE, the method commonly used in the US.
If only one SAE figure is published, the standard and largest values are the same.
N/A
2,166 L
295 L more cargo volume than the average Crossover
DriveSize space efficiency
DriveSize space efficiency compares blended cargo volume per square meter of footprint with the class average.
Blended cargo uses 65% of the standard figure and 35% of the largest figure within the selected cargo measurement method.
VDA values compare with VDA class averages, and SAE values compare with SAE class averages. Positive percentages indicate more space efficiency and negative percentages indicate less.
-25%
SAE: Less space efficient than the average Crossover
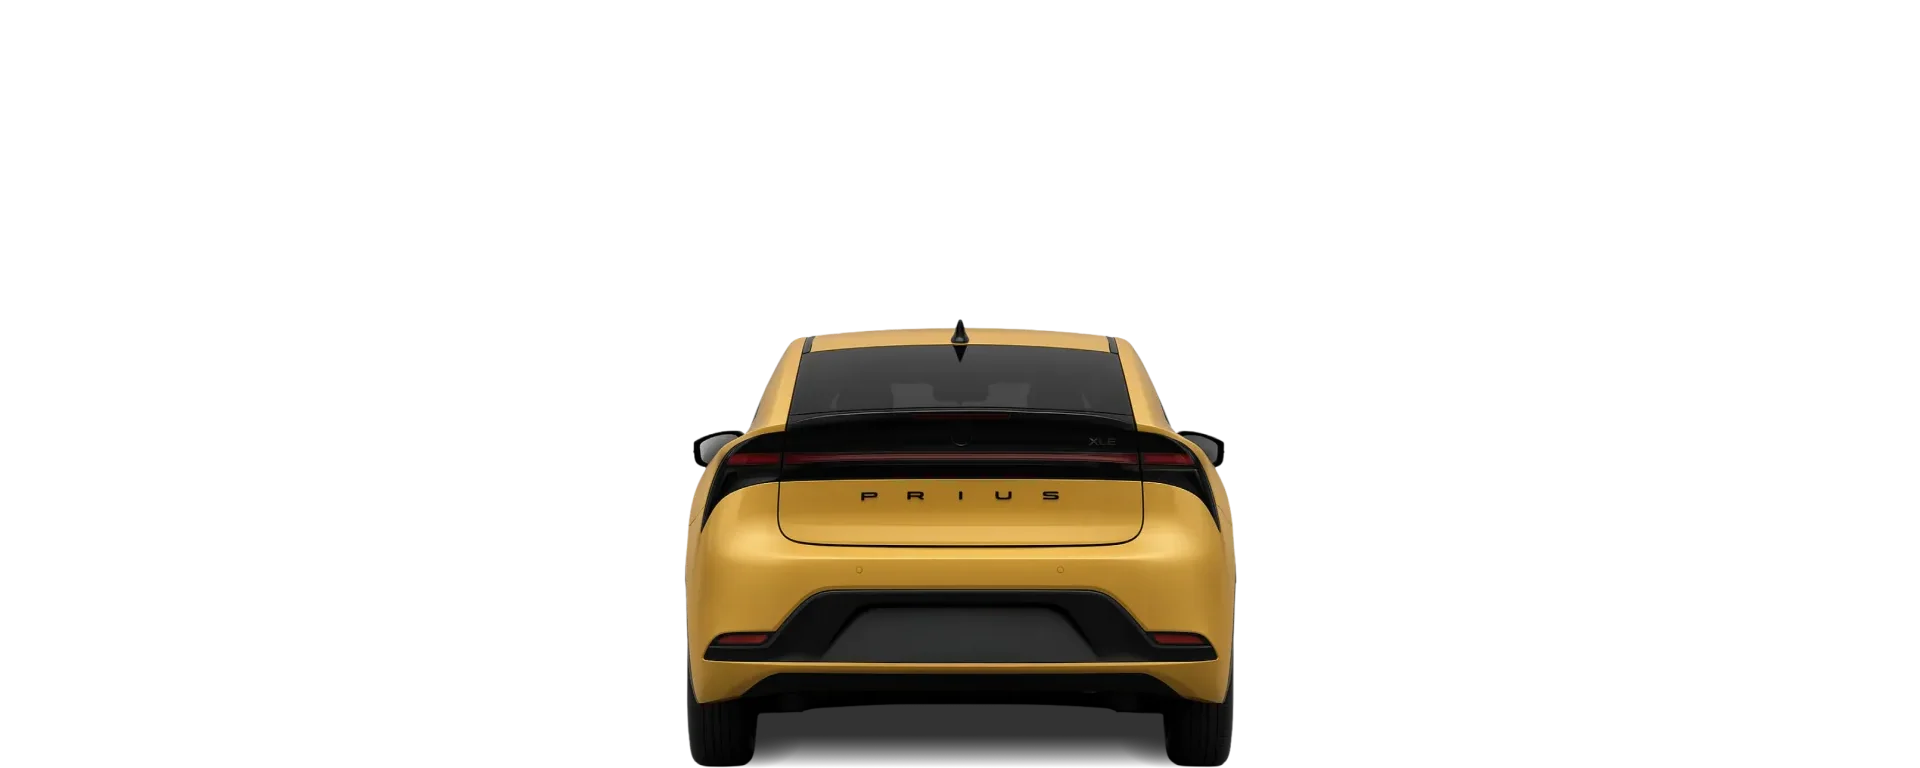
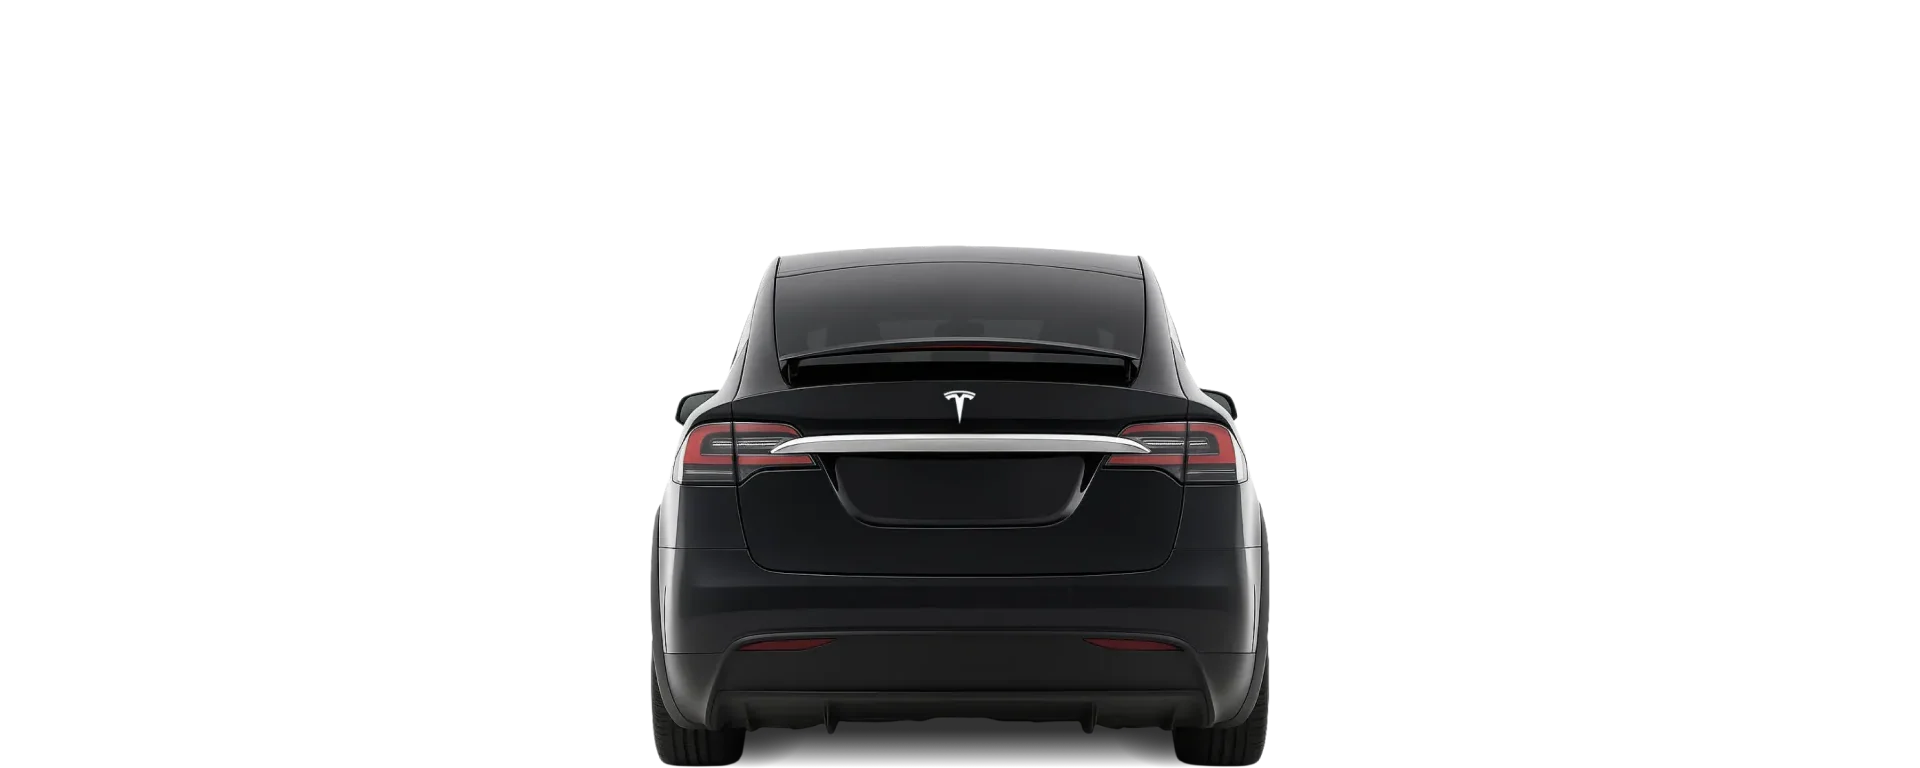
Rear view
Details
Doors, seats, weight, maneuverability
Neither vehicle differs on door layout, as the 2015 Tesla Model X and 2023 Toyota Prius both feature a 5-door design. Choosing the 2015 Tesla Model X fundamentally changes your passenger options, adding 2 more seats over the 2023 Toyota Prius. There is a significant gap in agility here; the 2023 Toyota Prius can spin around in a space 1.8 m smaller than the 2015 Tesla Model X.
Measurements
Doors
5
5
Max. seats
5
7 (+2)
Turning circle
10.5 m
12.3 m (+1.8)
Curb weight
1,545 kg
N/A
How each car compares with its class average
Turning circle
10.5 m
0.1 m larger turning circle than the average Hatchback
12.3 m
1.1 m larger turning circle than the average Crossover
Curb weight
1,545 kg
292 kg heavier than the average Hatchback
N/A
DriveSize manoeuvrability
DriveSize manoeuvrability combines turning circle and footprint, with turning circle weighted more heavily.
A positive percentage means more manoeuvrable than the class average and a negative percentage means less manoeuvrable.
-4%
Less manoeuvrable than the average Hatchback
-11%
Less manoeuvrable than the average Crossover
Parking
Will the 2023 Toyota Prius or 2015 Tesla Model X fit in a standard parking space?
2023 Toyota Prius parking fit score
DriveSize compares the car's width and length with typical parking-space sizes by region.
Vehicle dimensions are rounded up and available side or length clearance is rounded down.
Side clearance is based on body width where available; real spaces can vary because of mirrors, walls, pillars, kerbs, bay markings, and nearby cars.
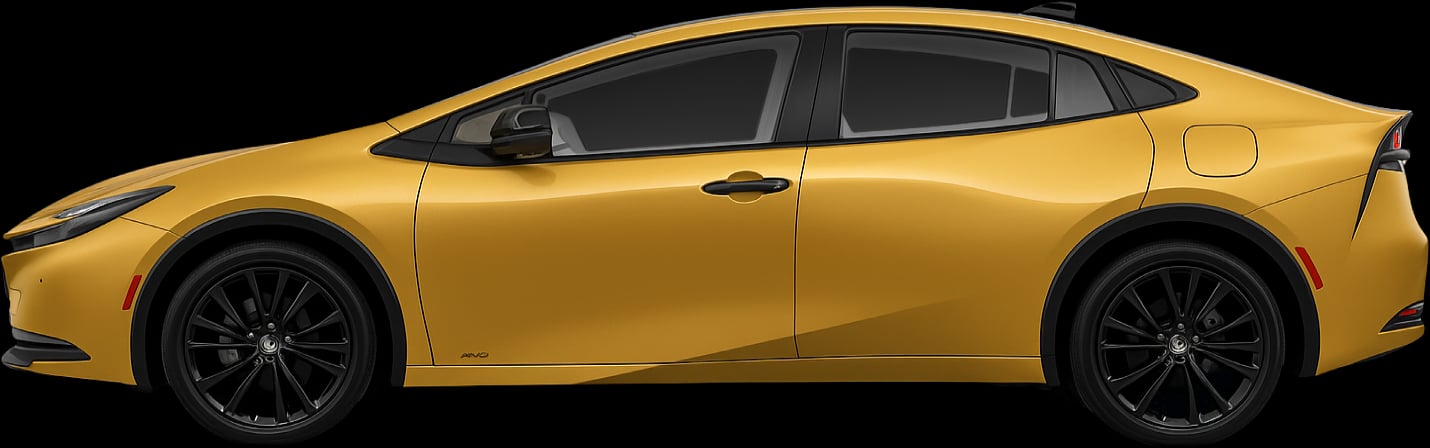
For an average USA / Canada space: body side clearance is 48 cm per side, and length clearance is 45 cm at each end.
Body side clearance
48 cm
Length clearance (at each end)
45 cm
2015 Tesla Model X parking fit score
DriveSize compares the car's width and length with typical parking-space sizes by region.
Vehicle dimensions are rounded up and available side or length clearance is rounded down.
Side clearance is based on body width where available; real spaces can vary because of mirrors, walls, pillars, kerbs, bay markings, and nearby cars.
For an average USA / Canada space: body side clearance is 37.5 cm per side, and length clearance is 22 cm at each end.
Body side clearance
37.5 cm
Length clearance (at each end)
22 cm
FAQs
Frequently asked questions
Vehicle specifications on this page are sourced from official Toyota and Tesla documentation. Unless the page identifies a specific trim, body style, powertrain or market version, DriveSize uses manufacturer-published specifications for the base model as its default reference. DriveSize standardises the published measurements and calculates the comparisons and derived figures shown. Figures can vary by market, model year, trim, powertrain, wheels, tyres and measurement method. How DriveSize sources and calculates these figures.