
2024 Ford F‑150 SuperCab 6.5ft bed 4x4 vs 1962 Peel P50
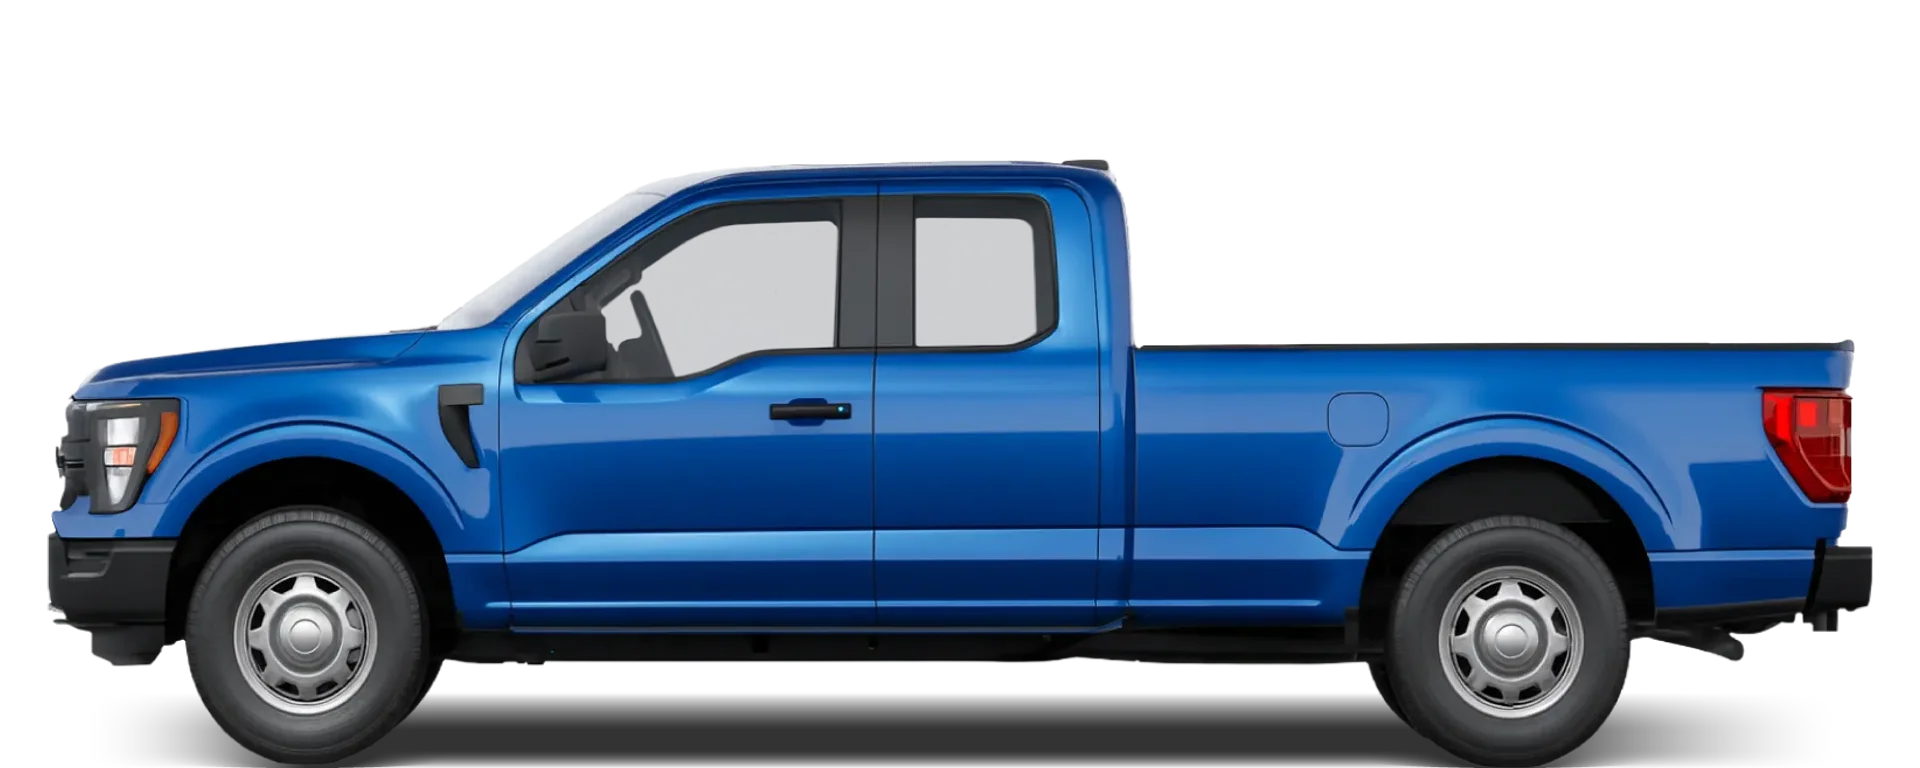

Which is bigger, the 2024 Ford F‑150 SuperCab 6.5ft bed 4x4 or 1962 Peel P50?
Key dimensions: length, width, height
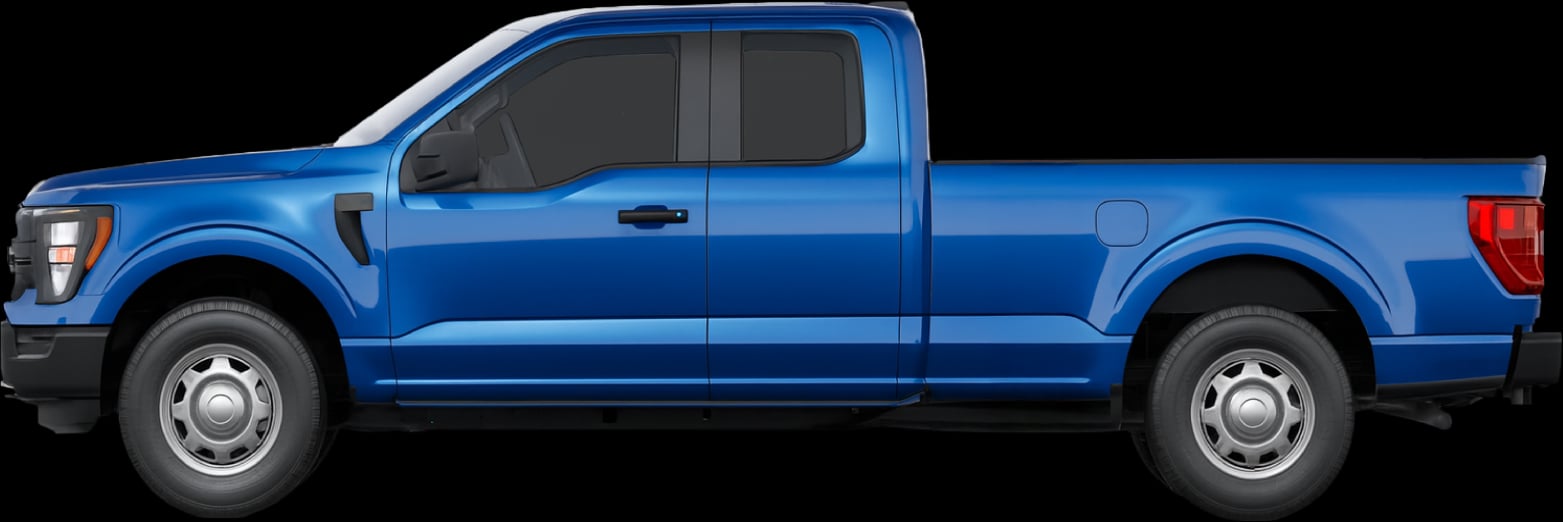
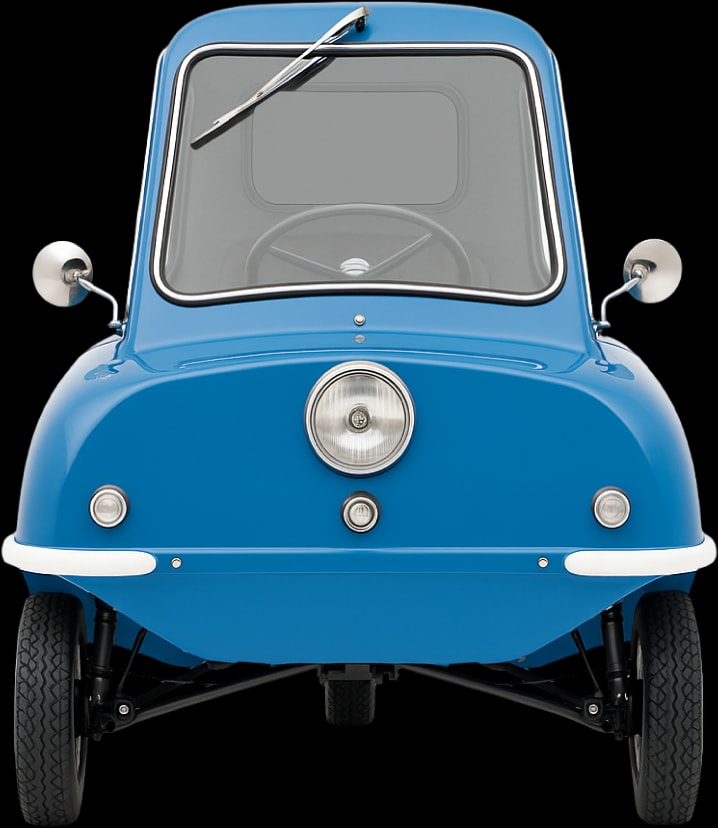
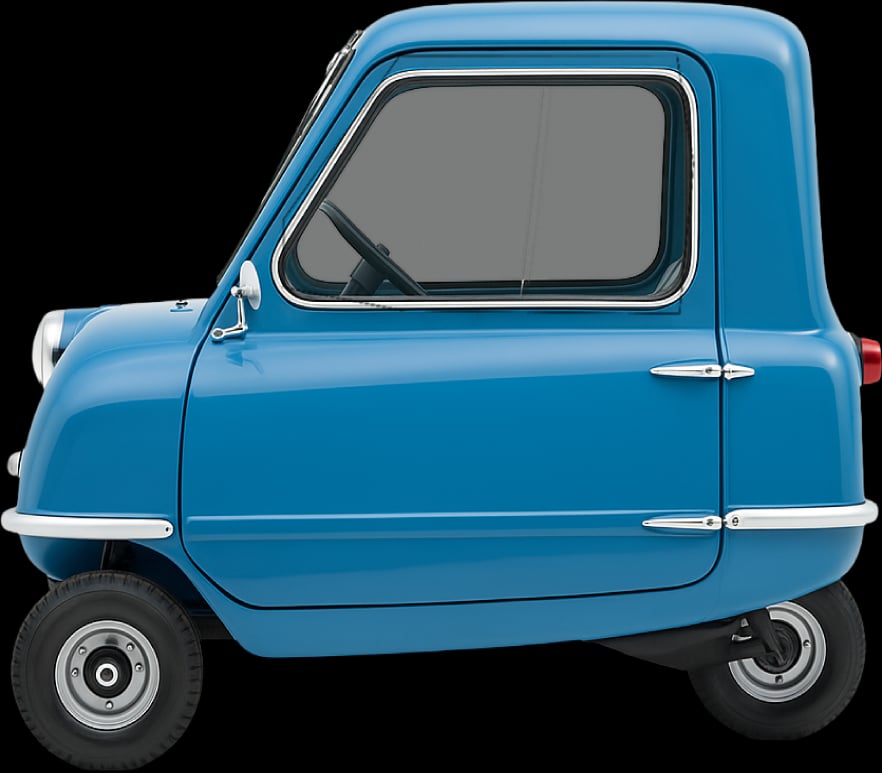
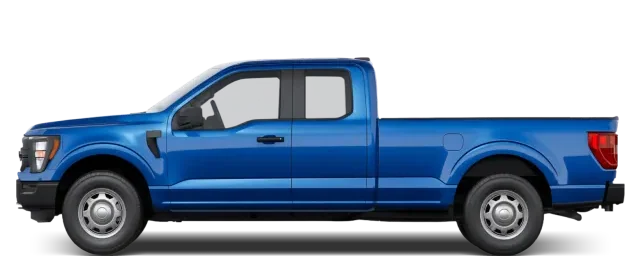
The figures show over 452.1 cm of separation between the 2024 Ford F‑150 SuperCab 6.5ft bed 4x4 and 1962 Peel P50, which is a huge difference. The 2024 Ford F‑150 SuperCab 6.5ft bed 4x4 is a massive 103.8 cm wider than the 1962 Peel P50, highlighting a complete shift in vehicle purpose and design. The roofline of the 2024 Ford F‑150 SuperCab 6.5ft bed 4x4 is 75.8 cm higher than that of the 1962 Peel P50, making the contrast immediately noticeable. The 2024 Ford F‑150 SuperCab 6.5ft bed 4x4 is effectively on stilts compared to the 1962 Peel P50, sitting an extra 12.2 cm off the ground. The 2024 Ford F‑150 SuperCab 6.5ft bed 4x4 is in a league of its own, with a wheelbase that is 249.3 cm longer than the 1962 Peel P50.
Measurements
Length
589.3 cm (+452.1)
137.2 cm
Height
195.8 cm (+75.8)
120 cm
Body width
202.9 cm (+103.8)
99.1 cm
Width including mirrors
243.1 cm
N/A
Ground clearance
24.9 cm (+12.2)
12.7 cm
Wheelbase
369.3 cm (+249.3)
120 cm
Footprint
DriveSize footprint is overall length multiplied by body width.
12 m² (+10.6)
1.4 m²
How each car compares with its class average
Length
589.3 cm
46.6 cm longer than the average Pickup
137.2 cm
161.7 cm shorter than the average Microcar
Height
195.8 cm
9 cm taller than the average Pickup
120 cm
36 cm shorter than the average Microcar
Body width
202.9 cm
8.5 cm wider than the average Pickup
99.1 cm
48.2 cm narrower than the average Microcar
Width including mirrors
243.1 cm
20.2 cm wider than the average Pickup
N/A
Ground clearance
24.9 cm
2.1 cm more ground clearance than the average Pickup
12.7 cm
1.5 cm less ground clearance than the average Microcar
Wheelbase
369.3 cm
38.3 cm longer wheelbase than the average Pickup
120 cm
86.7 cm shorter wheelbase than the average Microcar
Footprint
DriveSize footprint is overall length multiplied by body width.
12 m²
1.4 m² larger footprint than the average Pickup
1.4 m²
3.1 m² smaller footprint than the average Microcar
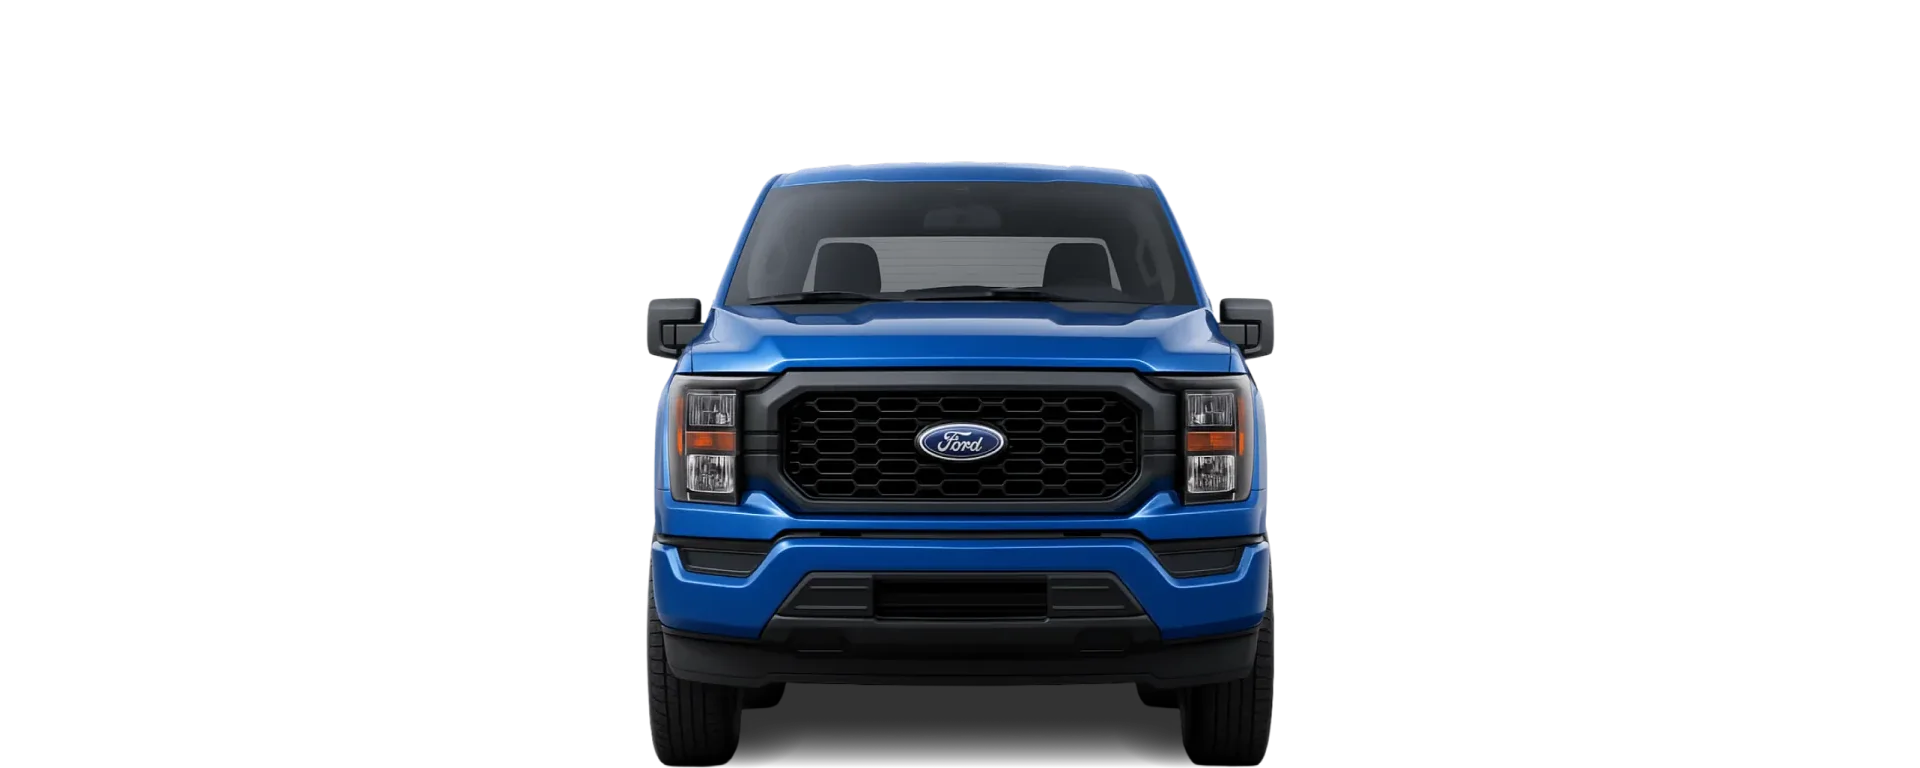
Front view

Cargo Capacity: which has more space?
Standard and largest cargo capacity
The 2024 Ford F‑150 SuperCab 6.5ft bed 4x4 features a 1,764 L (SAE) boot with the seats up, which is way above average for its category. The 2024 Ford F‑150 SuperCab 6.5ft bed 4x4 has 1,764 L (SAE) of cargo space with its seats down, which is typical compared to the class average for pickup.
Measurements
Standard cargo capacity (SAE)
The standard cargo capacity using SAE, the method commonly used in the US.
This is the manufacturer's normal published figure; it does not imply a particular seat configuration.
1,764 L
N/A
Largest cargo capacity (SAE)
The largest cargo capacity using SAE, the method commonly used in the US.
If only one SAE figure is published, the standard and largest values are the same.
1,764 L
N/A
Cargo space vs length
This DriveSize metric divides blended cargo volume by overall vehicle length.
Blended cargo uses 65% of the standard figure and 35% of the largest figure, using VDA where available and SAE otherwise.
299.3 L per m
N/A
Cargo space vs footprint
This DriveSize metric divides blended cargo volume by footprint.
Blended cargo uses 65% of the standard figure and 35% of the largest figure, using VDA where available and SAE otherwise.
It helps show how efficiently a car turns exterior area into usable cargo space.
147.5 L per m²
N/A
How each car compares with its class average
Standard cargo capacity (SAE)
The standard cargo capacity using SAE, the method commonly used in the US.
This is the manufacturer's normal published figure; it does not imply a particular seat configuration.
1,764 L
327 L more cargo volume than the average Pickup
N/A
Largest cargo capacity (SAE)
The largest cargo capacity using SAE, the method commonly used in the US.
If only one SAE figure is published, the standard and largest values are the same.
1,764 L
237 L more cargo volume than the average Pickup
N/A
DriveSize space efficiency
DriveSize space efficiency compares blended cargo volume per square meter of footprint with the class average.
Blended cargo uses 65% of the standard figure and 35% of the largest figure within the selected cargo measurement method.
VDA values compare with VDA class averages, and SAE values compare with SAE class averages. Positive percentages indicate more space efficiency and negative percentages indicate less.
+20%
SAE: More space efficient than the average Pickup
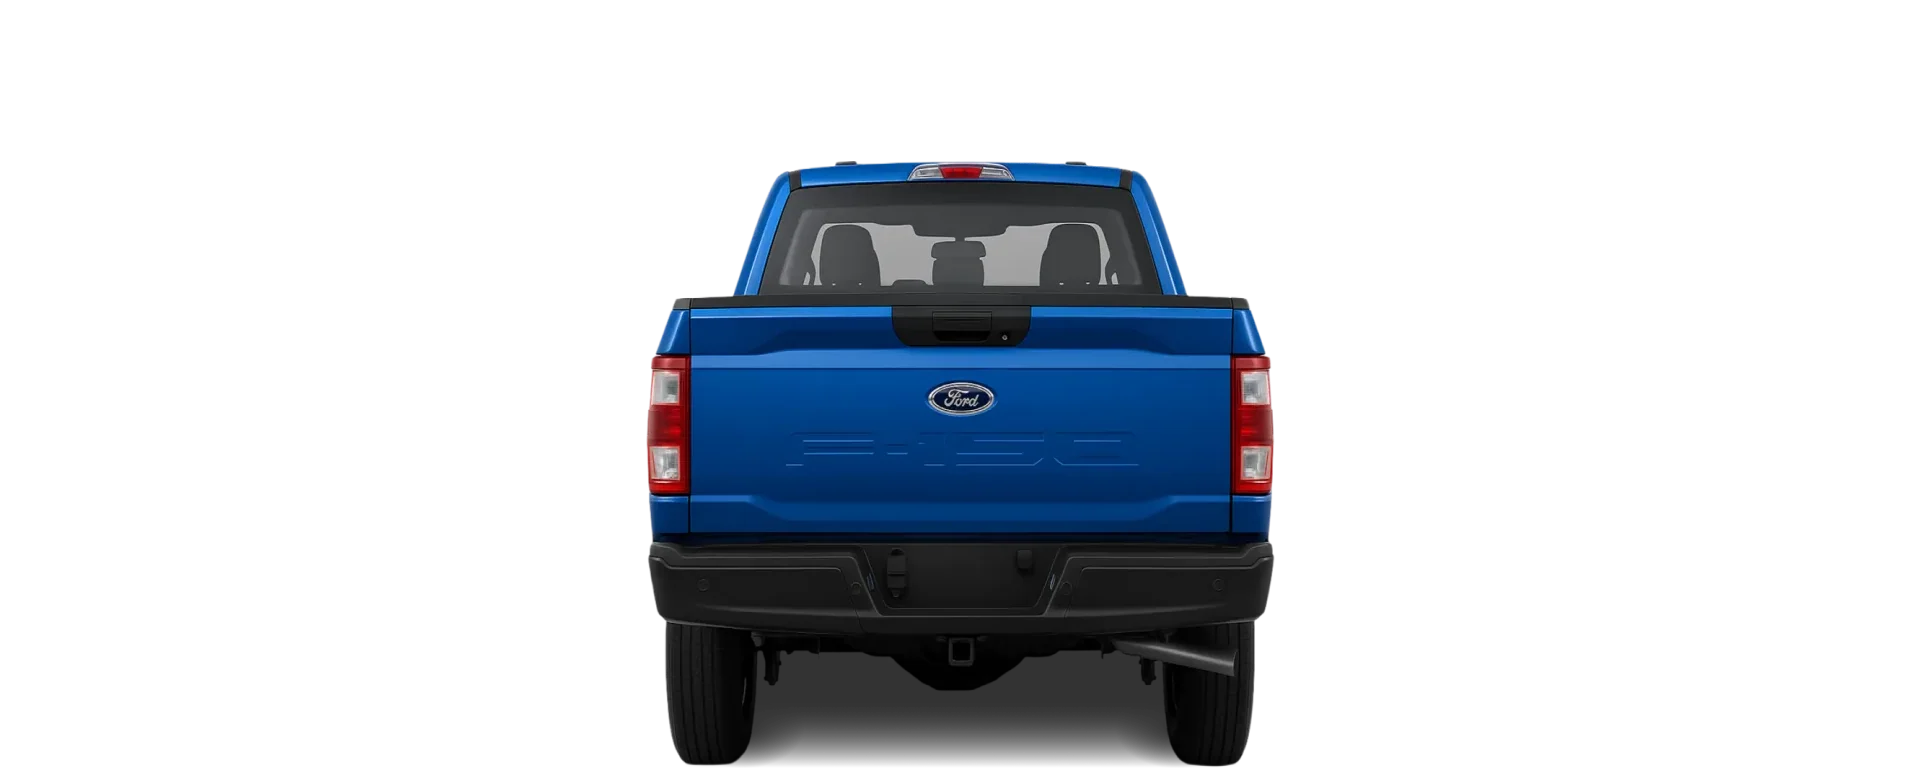
Rear view

Details
Doors, seats, weight, maneuverability
With an extra 3 doors, the 2024 Ford F‑150 SuperCab 6.5ft bed 4x4 makes loading child seats or shopping easier than in the 1-door 1962 Peel P50. The 2024 Ford F‑150 SuperCab 6.5ft bed 4x4 can carry a staggering 5 more passengers than the 1962 Peel P50, meaning we're looking at completely different purposes for these two vehicles. If you drive both cars, you'll feel the extreme 10.9 m turning circle difference every time you try to park the 2024 Ford F‑150 SuperCab 6.5ft bed 4x4 in a standard bay. We’re talking about a 2,161 kg weight shift, which places these two vehicles in completely different worlds of physics.
Measurements
Doors
4 (+3)
1
Max. seats
6 (+5)
1
Turning circle
14.6 m (+10.9)
3.7 m
Curb weight
2,220 kg (+2,161)
59 kg
How each car compares with its class average
Turning circle
14.6 m
1.5 m larger turning circle than the average Pickup
3.7 m
4.6 m smaller turning circle than the average Microcar
Curb weight
2,220 kg
31 kg lighter than the average Pickup
59 kg
643 kg lighter than the average Microcar
DriveSize manoeuvrability
DriveSize manoeuvrability combines turning circle and footprint, with turning circle weighted more heavily.
A positive percentage means more manoeuvrable than the class average and a negative percentage means less manoeuvrable.
-12%
Less manoeuvrable than the average Pickup
+2%
More manoeuvrable than the average Microcar
Parking
Will the 2024 Ford F‑150 SuperCab 6.5ft bed 4x4 or 1962 Peel P50 fit in a standard parking space?
2024 Ford F‑150 SuperCab 6.5ft bed 4x4 parking fit score
DriveSize compares the car's width and length with typical parking-space sizes by region.
Vehicle dimensions are rounded up and available side or length clearance is rounded down.
Side clearance is based on body width where available; real spaces can vary because of mirrors, walls, pillars, kerbs, bay markings, and nearby cars.
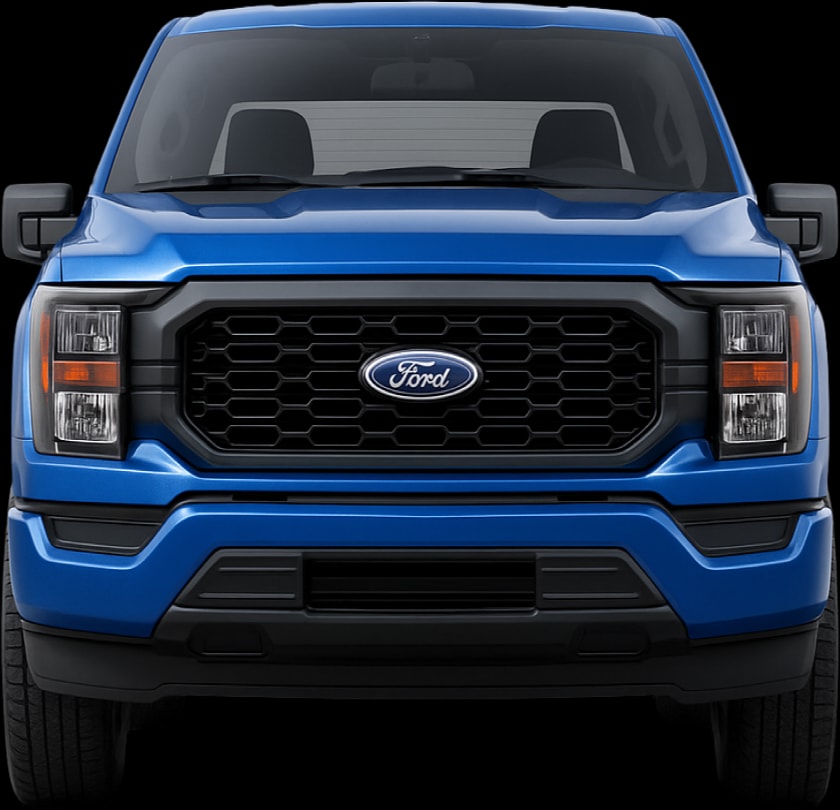
For an average USA / Canada space: exceeds the bay's length by 40 cm.
Body side clearance
36 cm
Length over bay
40 cm
Overall length. Primary constraint.
1962 Peel P50 parking fit score
DriveSize compares the car's width and length with typical parking-space sizes by region.
Vehicle dimensions are rounded up and available side or length clearance is rounded down.
Side clearance is based on body width where available; real spaces can vary because of mirrors, walls, pillars, kerbs, bay markings, and nearby cars.
For an average USA / Canada space: body side clearance is 87.5 cm per side, and length clearance is 206 cm at each end.
Body side clearance
87.5 cm
Length clearance (at each end)
206 cm
Articles featuring these cars
View all
Will Your Car Fit in a Standard Parking Space? Parking Space Sizes Explained
Find out if your car will fit in a standard parking space. Compare UK, US and international parking bay sizes, and check real vehicle fit with DriveSize.
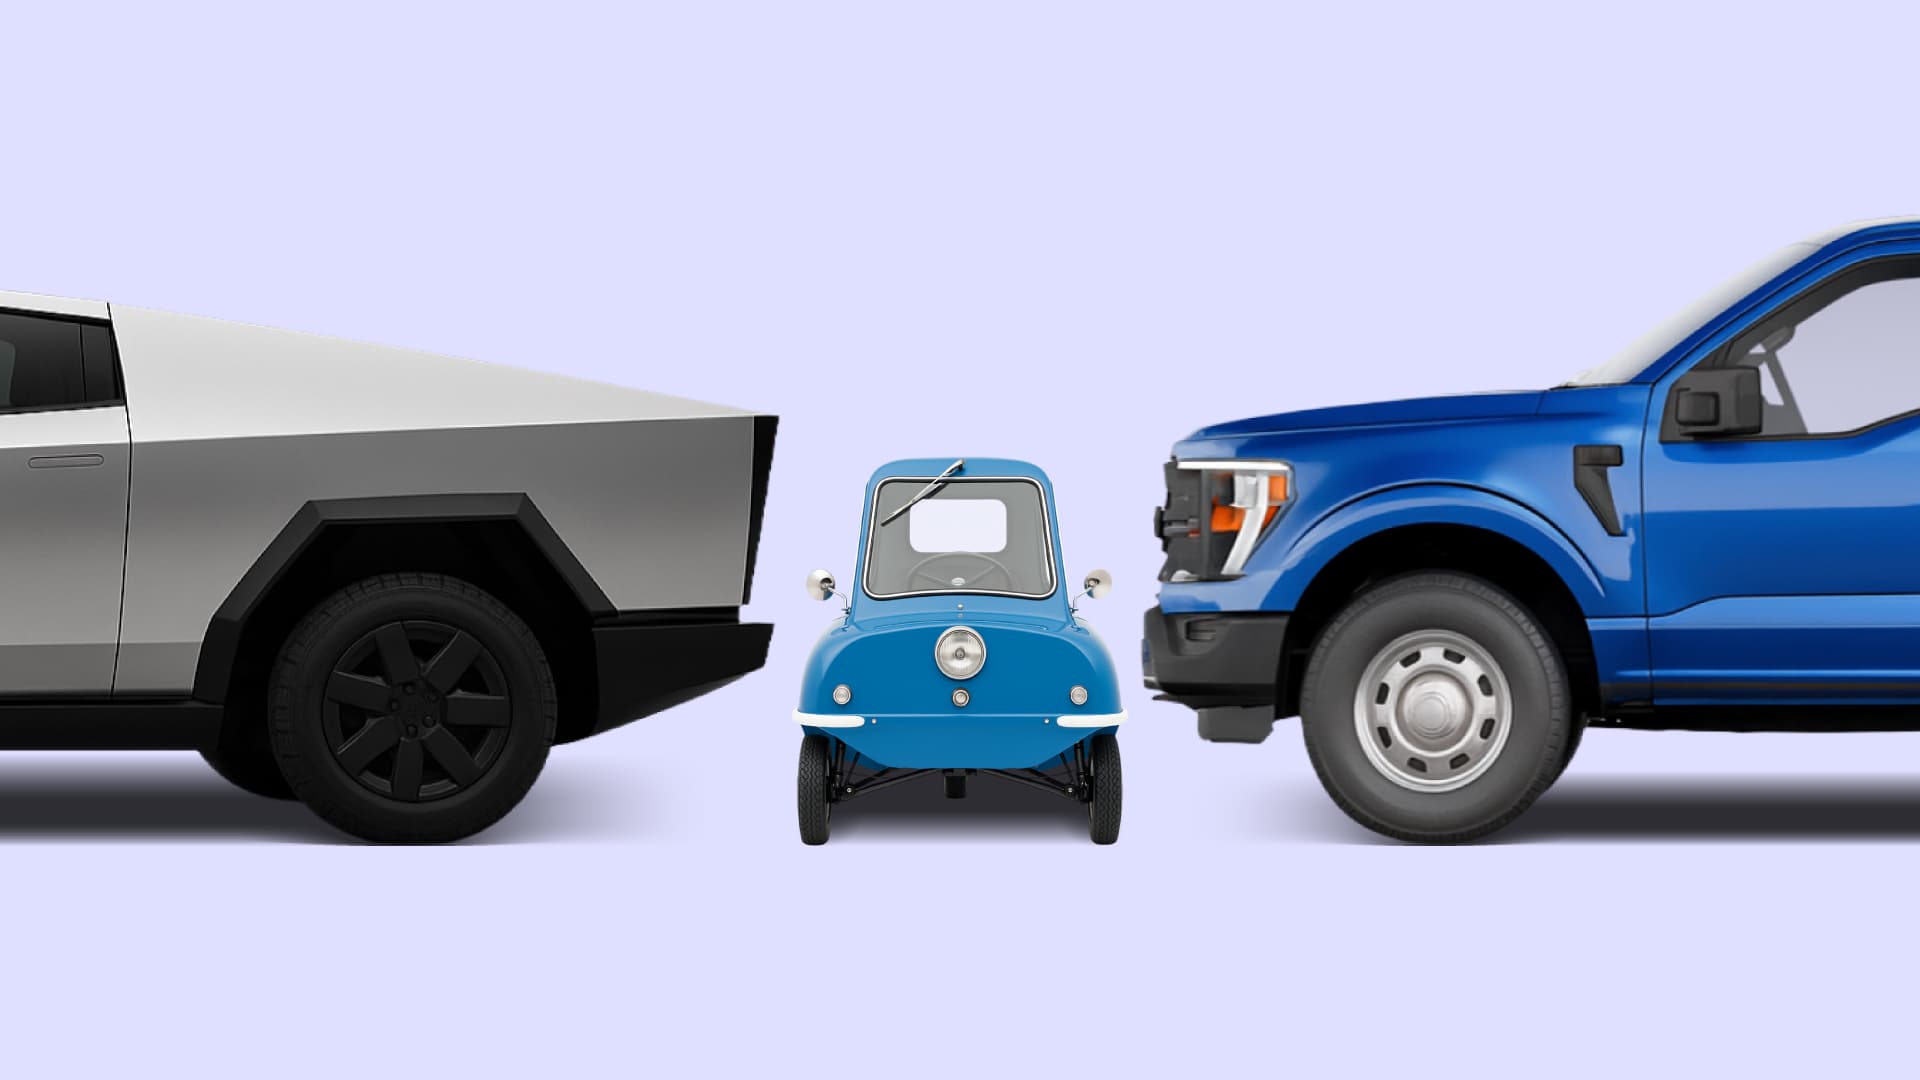
Smallest Car vs the Giants: Peel P50 vs Cybertruck, F-150, Land Cruiser, Palisade & Wrangler
How tiny is the Peel P50 really? See it compared with giants like the Cybertruck, F-150, Land Cruiser, Palisade and Wrangler using real dimensions.
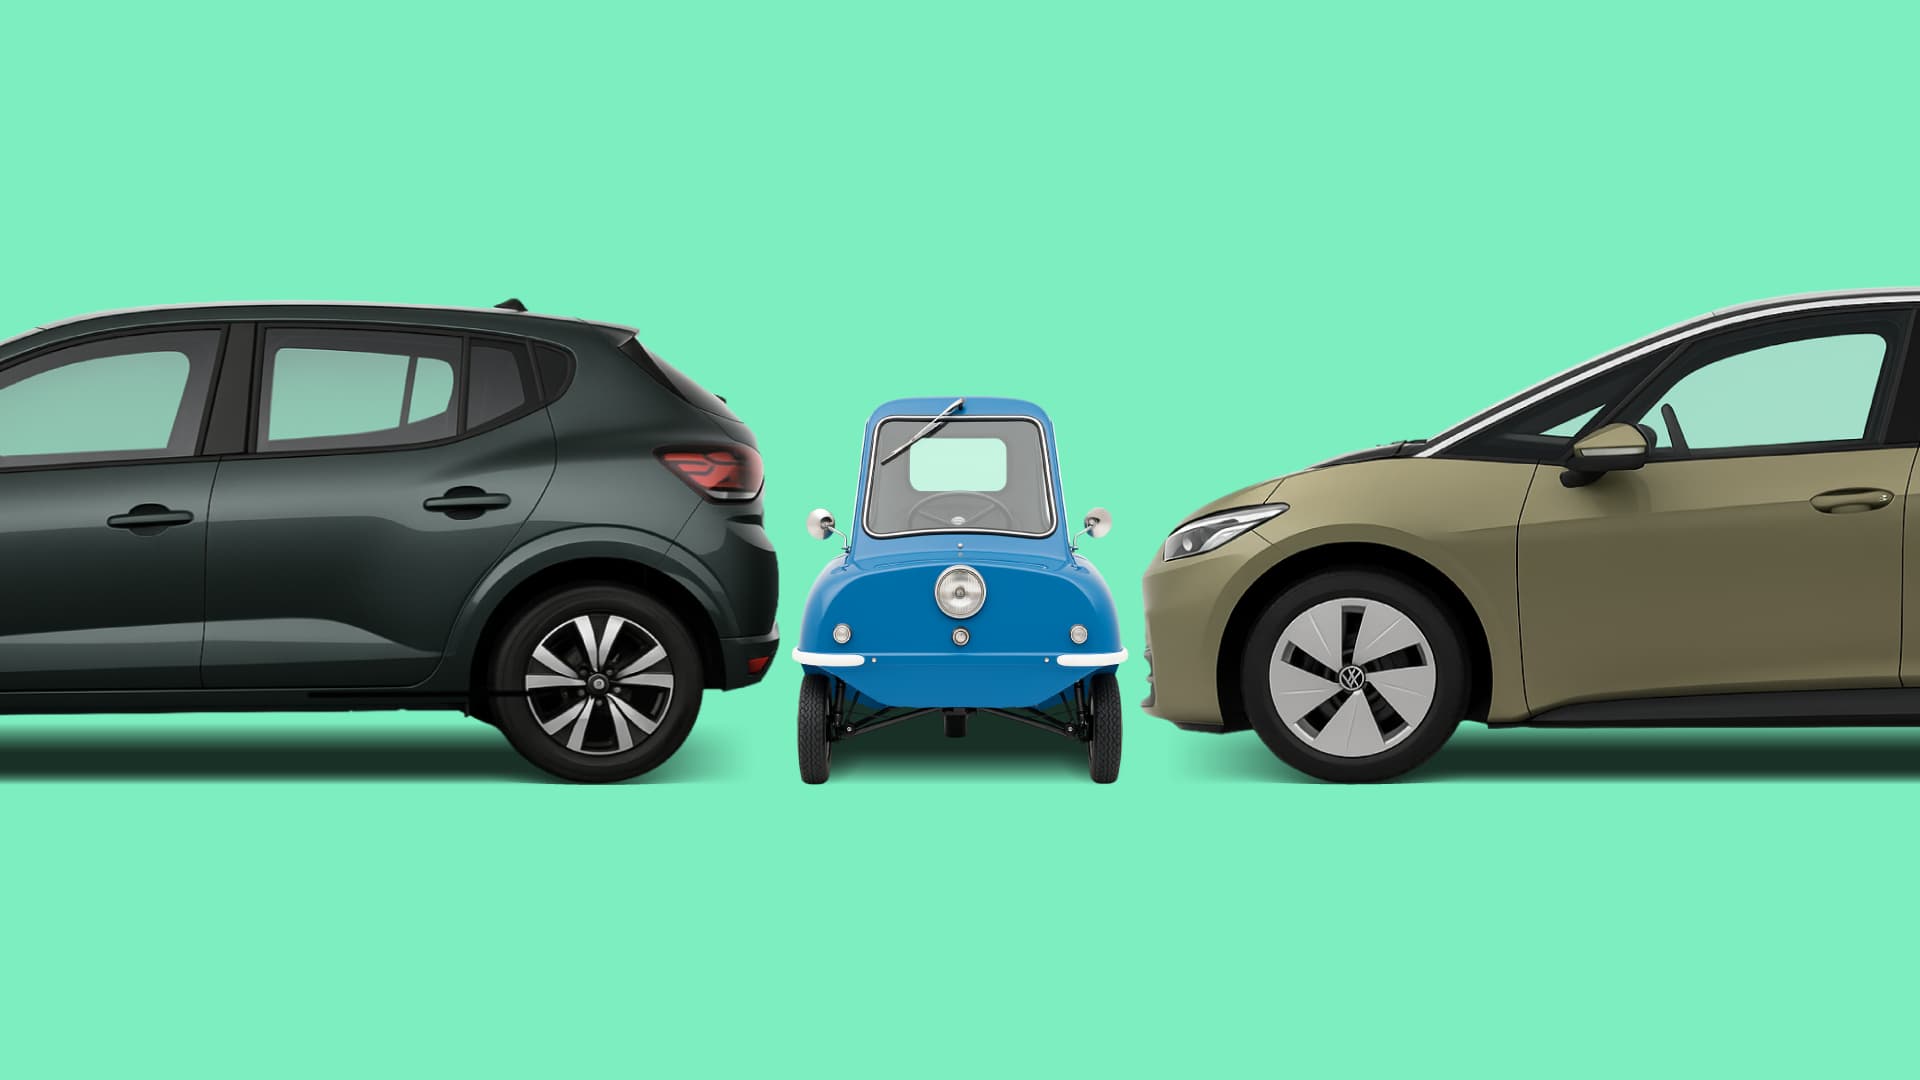
Smallest Car in the World? Peel P50 vs Today’s City Cars (Sandero, Golf & More)
How tiny is the Peel P50? See it compared to today’s city cars including the VW Golf, Toyota Corolla, Dacia Sandero, VW Polo and ID.3 in real dimensions.
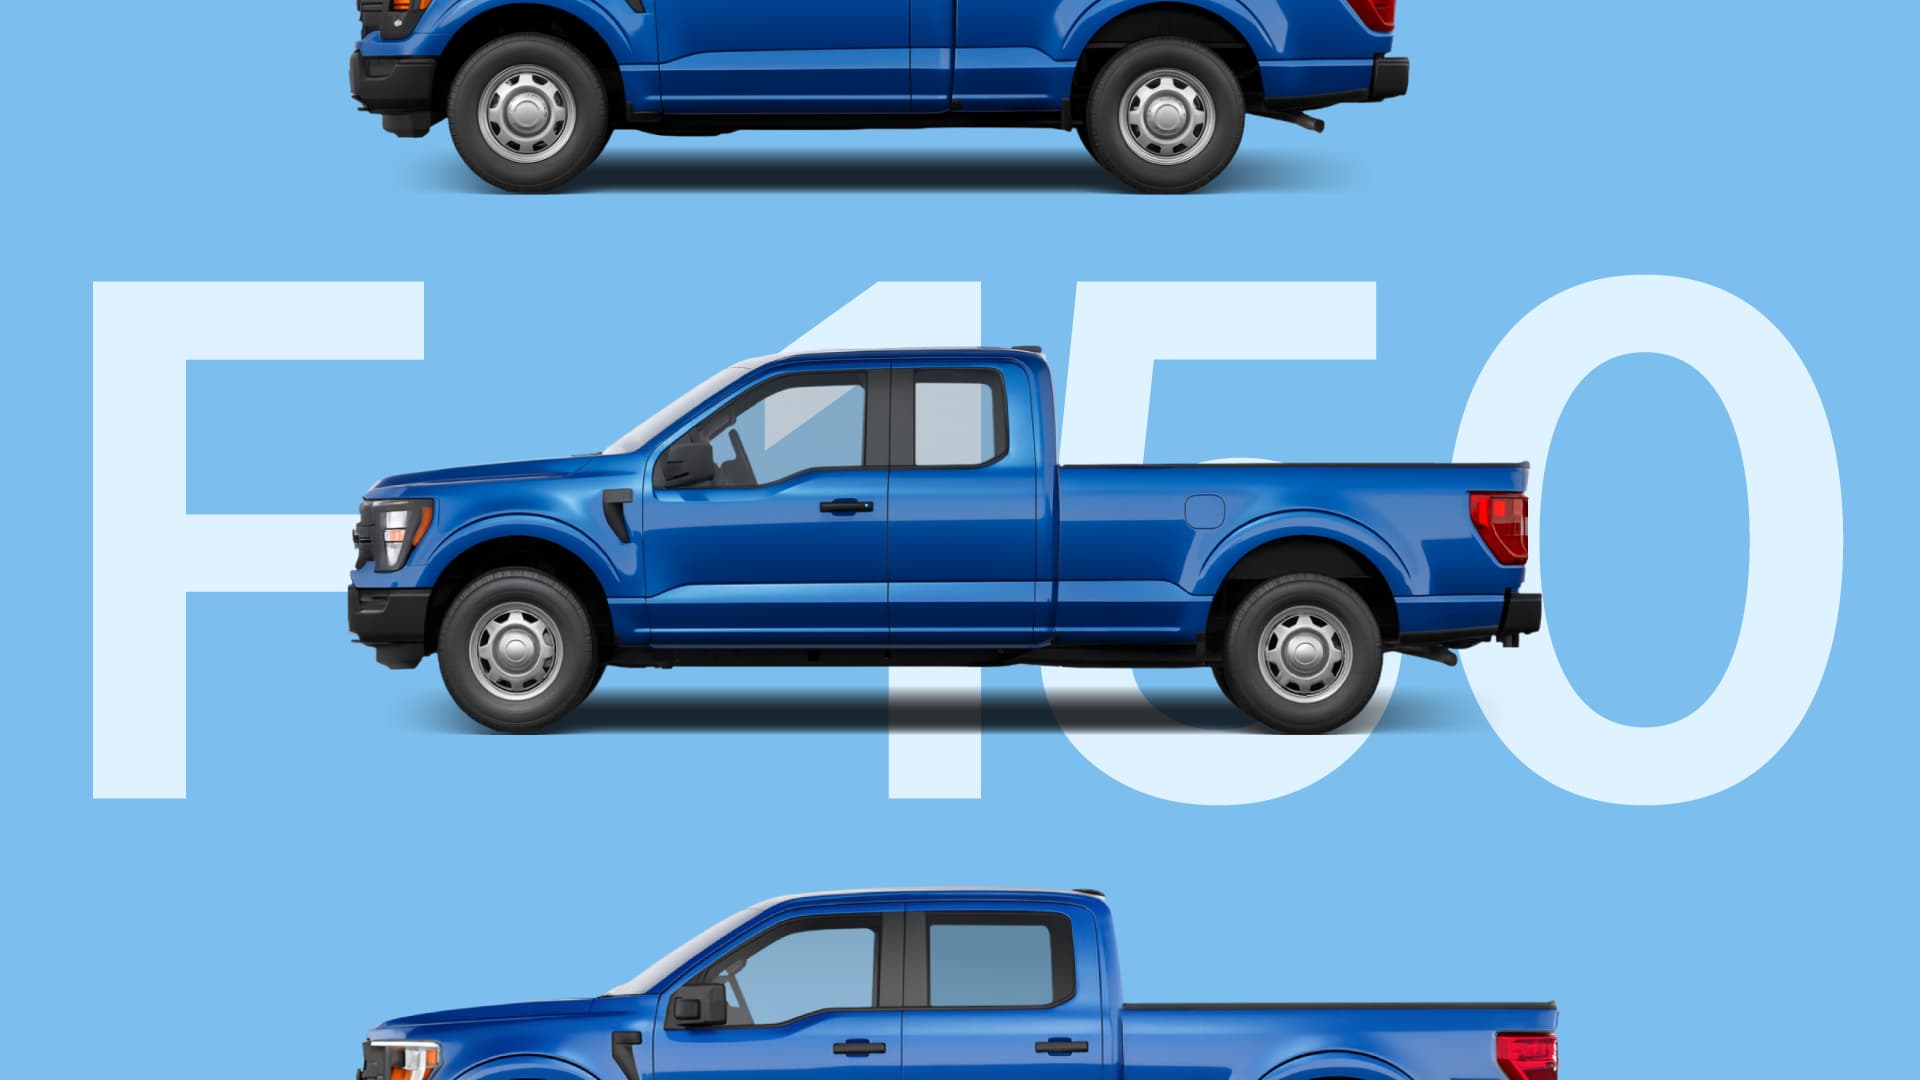
Ford F-150 Cab & Bed Sizes Explained: Regular Cab vs SuperCab vs SuperCrew
Understand Ford F-150 SuperCrew, SuperCab and Regular Cab sizes, bed lengths, passenger space, footprint and turning circle.
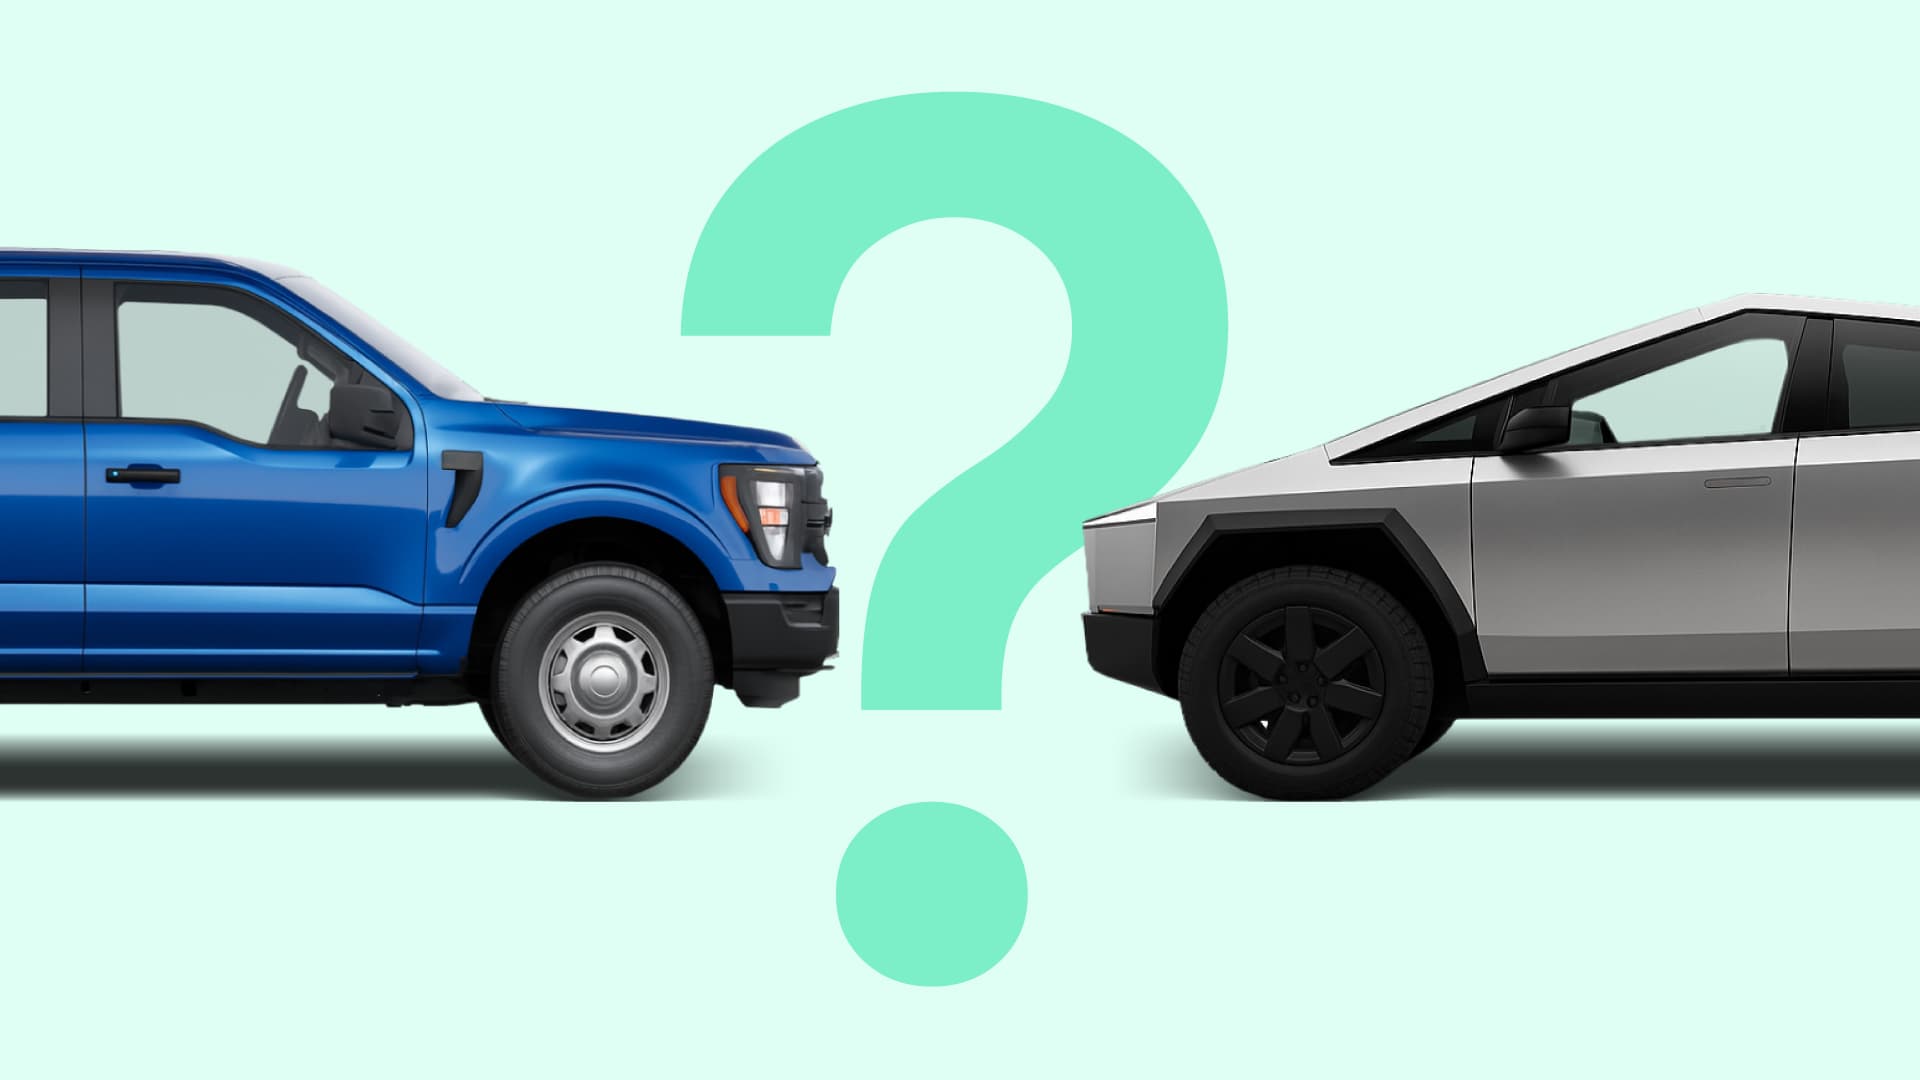
Ford F-150 vs Tesla Cybertruck: Dimensions, Bed Sizes, Width & Parking
We compare the Ford F-150 and Tesla Cybertruck on size, width, bed length, and parking practicality. See which pickup fits your driveway best — with real dimensions, wheelbase, and turning circle data from Drivesize.
How to Understand Car Dimensions: Length, Width, Wheelbase and More
Confused by car dimensions? Learn how length, width, height, wheelbase and ground clearance affect comfort, space and performance. The ultimate 2025 guide for smart car buyers.
FAQs
Frequently asked questions
Vehicle specifications on this page are sourced from official Ford and Peel documentation. Unless the page identifies a specific trim, body style, powertrain or market version, DriveSize uses manufacturer-published specifications for the base model as its default reference. DriveSize standardises the published measurements and calculates the comparisons and derived figures shown. Figures can vary by market, model year, trim, powertrain, wheels, tyres and measurement method. How DriveSize sources and calculates these figures.