
2013 Tesla Model S vs 2021 Ford Mustang Mach‑E
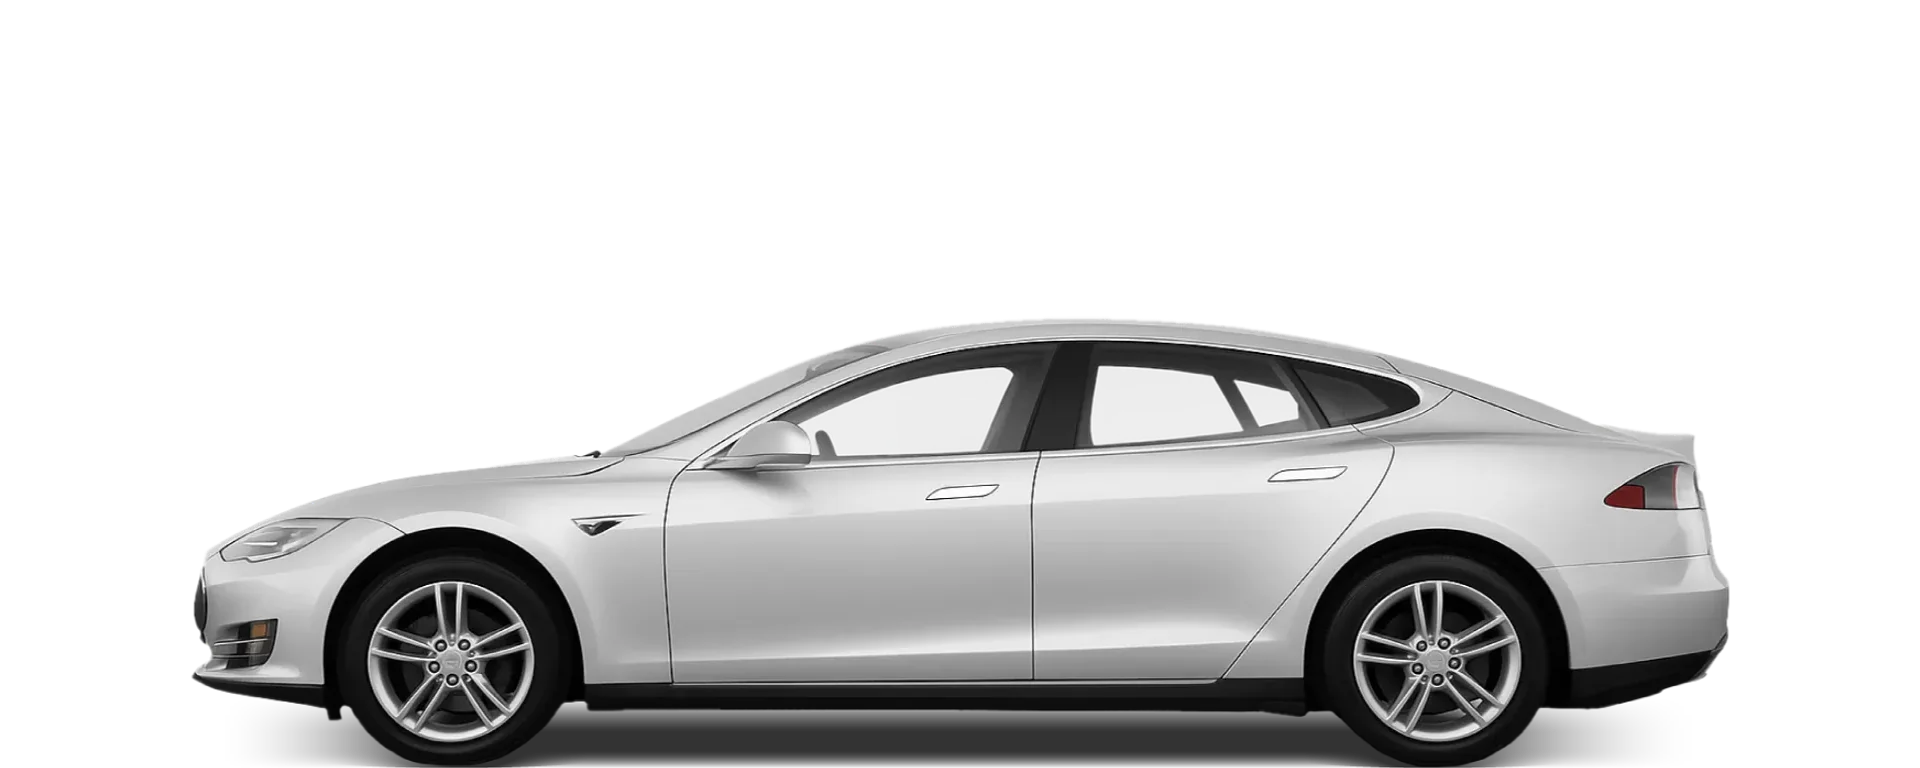
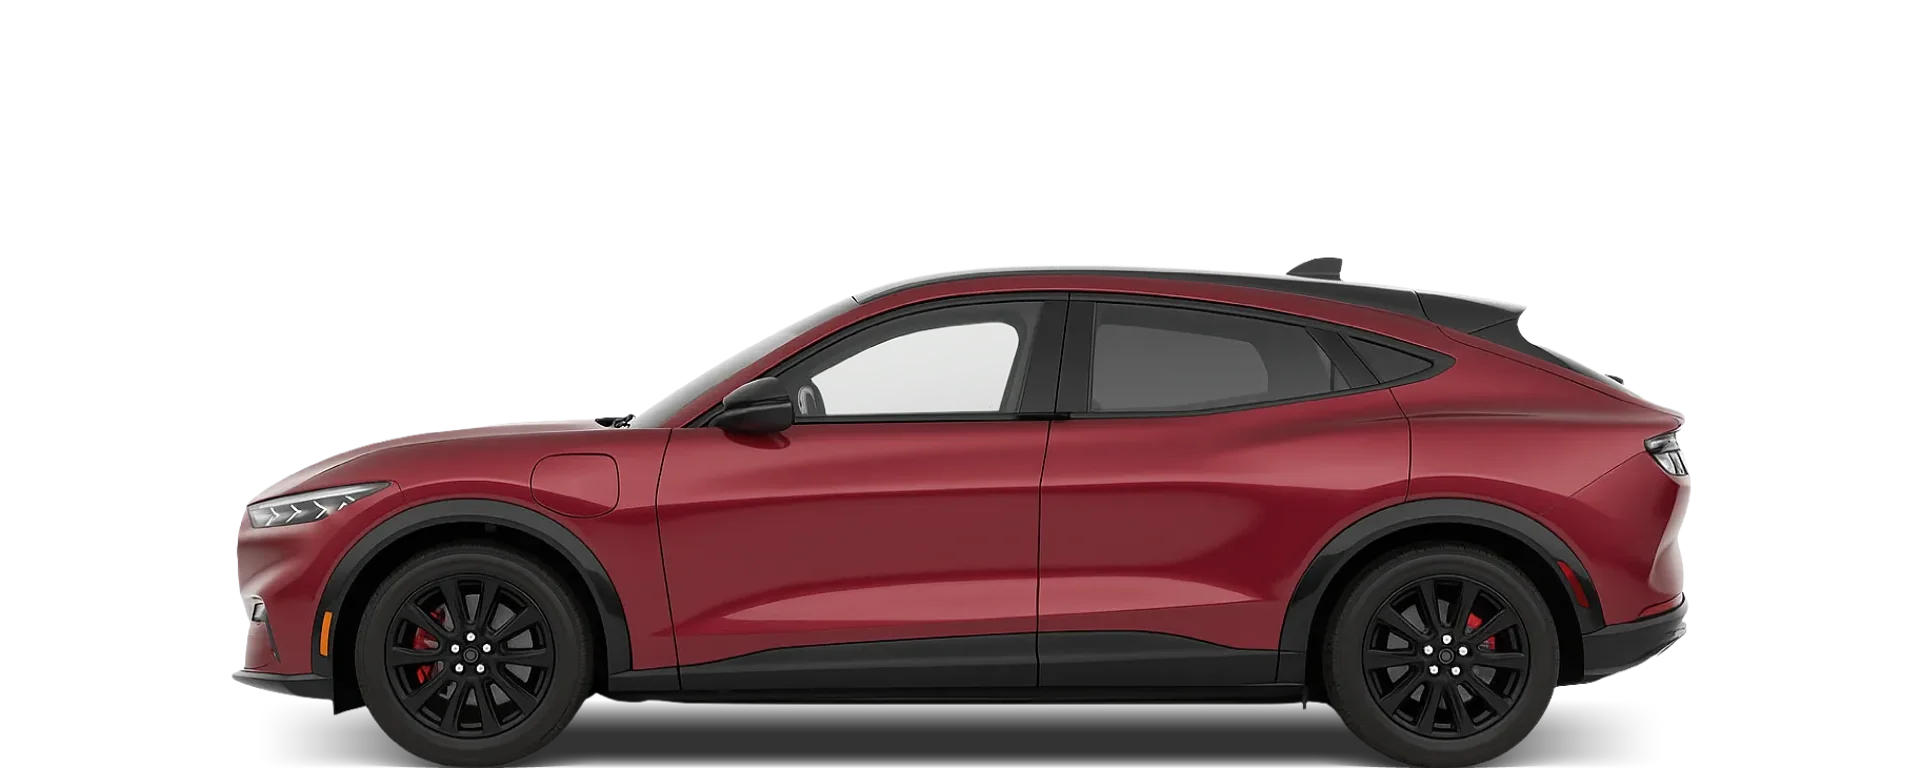
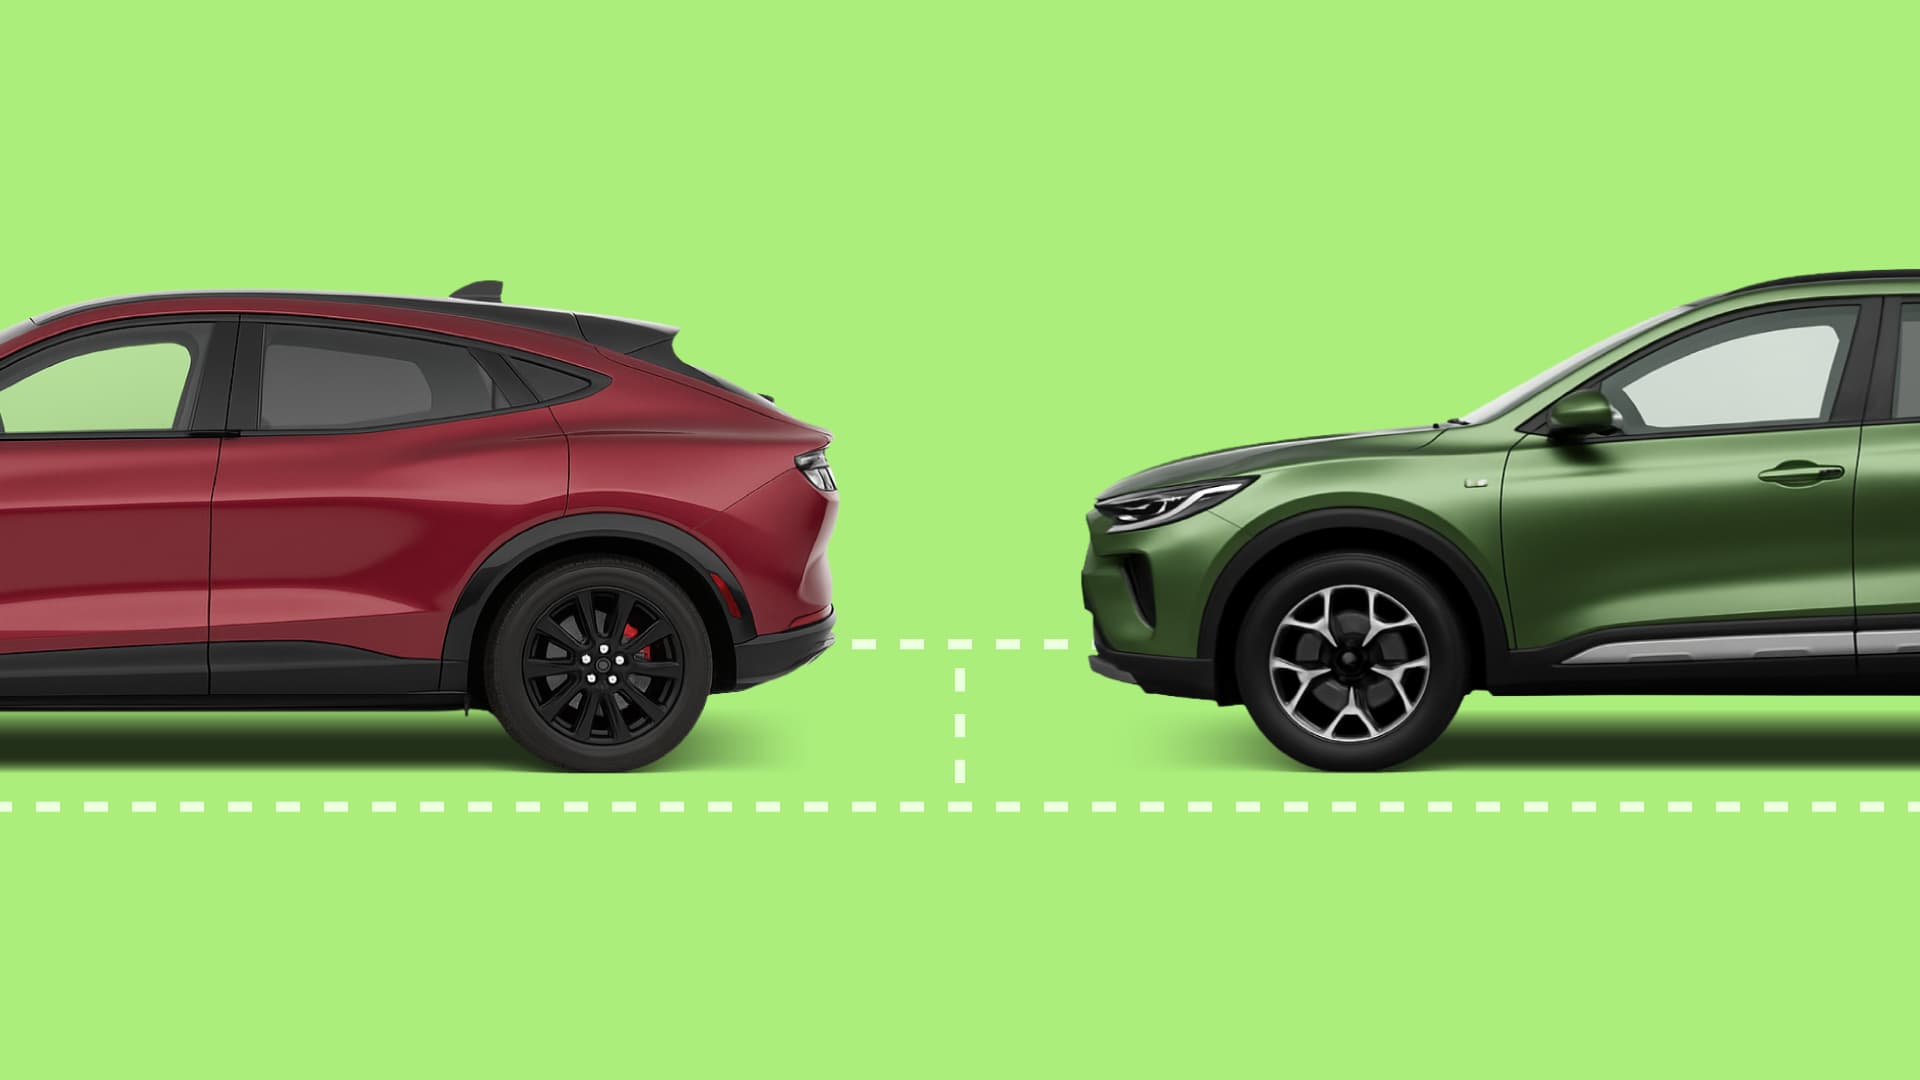
Which is bigger, the 2013 Tesla Model S or 2021 Ford Mustang Mach‑E?
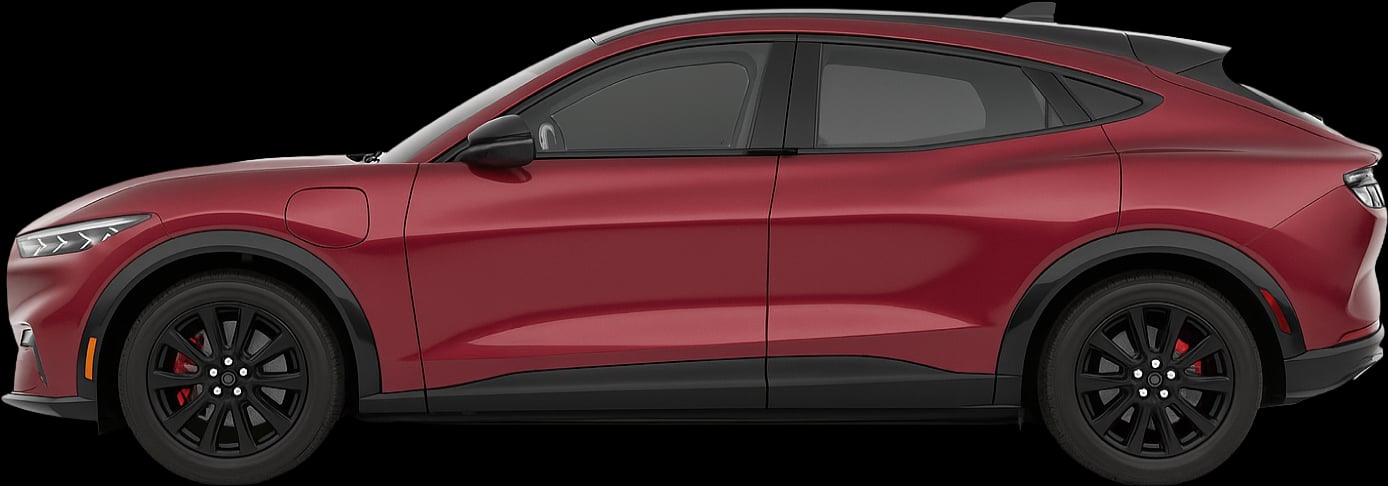
Key dimensions: length, width, height
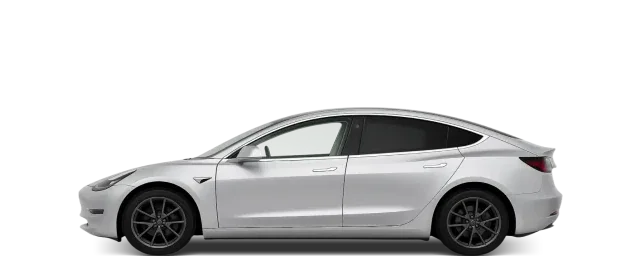
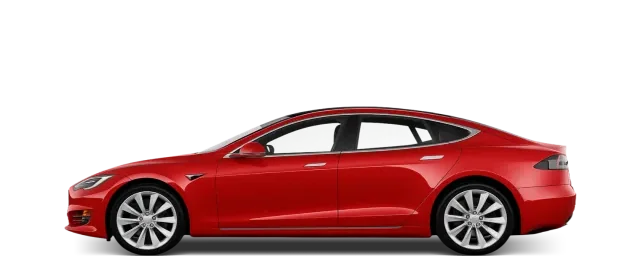
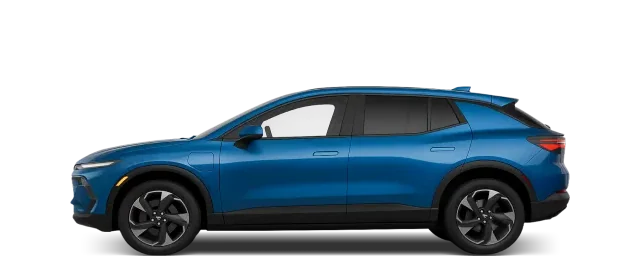
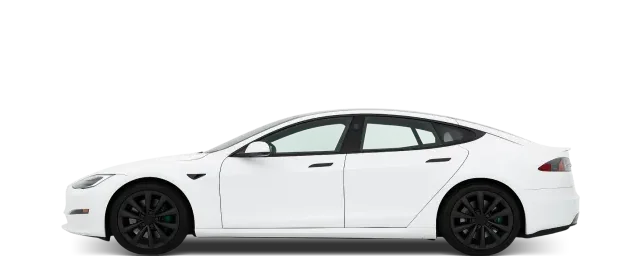
The 2013 Tesla Model S is an additional 25.7 cm longer than the 2021 Ford Mustang Mach‑E, giving it a more elongated and sleek profile. You might notice the 8.2 cm width difference when parking; the 2013 Tesla Model S leaves a little less margin for error in the bay compared to the 2021 Ford Mustang Mach‑E. A 19.8 cm height difference means the 2021 Ford Mustang Mach‑E will feel much more substantial when you're behind the wheel compared to the 2013 Tesla Model S. The 2013 Tesla Model S is only 1 cm more elevated than the 2021 Ford Mustang Mach‑E, a difference you likely won't notice even on rougher roads. Interior legroom will feel nearly identical, as the 2021 Ford Mustang Mach‑E adds only 2.4 cm to the 2013 Tesla Model S’s wheelbase.
Measurements
Length
497 cm (+25.7)
471.3 cm
Height
142.7 cm
162.5 cm (+19.8)
Body width
196.3 cm (+8.2)
188.1 cm
Width including mirrors
218.9 cm (+9.2)
209.7 cm
Ground clearance
15.5 cm (+1)
14.5 cm
Wheelbase
296 cm
298.4 cm (+2.4)
Footprint
DriveSize footprint is overall length multiplied by body width.
9.8 m² (+0.9)
8.9 m²
How each car compares with its class average
Length
497 cm
24.1 cm longer than the average Sedan
471.3 cm
18.7 cm longer than the average Crossover
Height
142.7 cm
3.1 cm shorter than the average Sedan
162.5 cm
0.3 cm shorter than the average Crossover
Body width
196.3 cm
13.3 cm wider than the average Sedan
188.1 cm
3.2 cm wider than the average Crossover
Width including mirrors
218.9 cm
13.3 cm wider than the average Sedan
209.7 cm
3.3 cm wider than the average Crossover
Ground clearance
15.5 cm
1.5 cm more ground clearance than the average Sedan
14.5 cm
3.6 cm less ground clearance than the average Crossover
Wheelbase
296 cm
17.9 cm longer wheelbase than the average Sedan
298.4 cm
26 cm longer wheelbase than the average Crossover
Footprint
DriveSize footprint is overall length multiplied by body width.
9.8 m²
1.1 m² larger footprint than the average Sedan
8.9 m²
0.5 m² larger footprint than the average Crossover
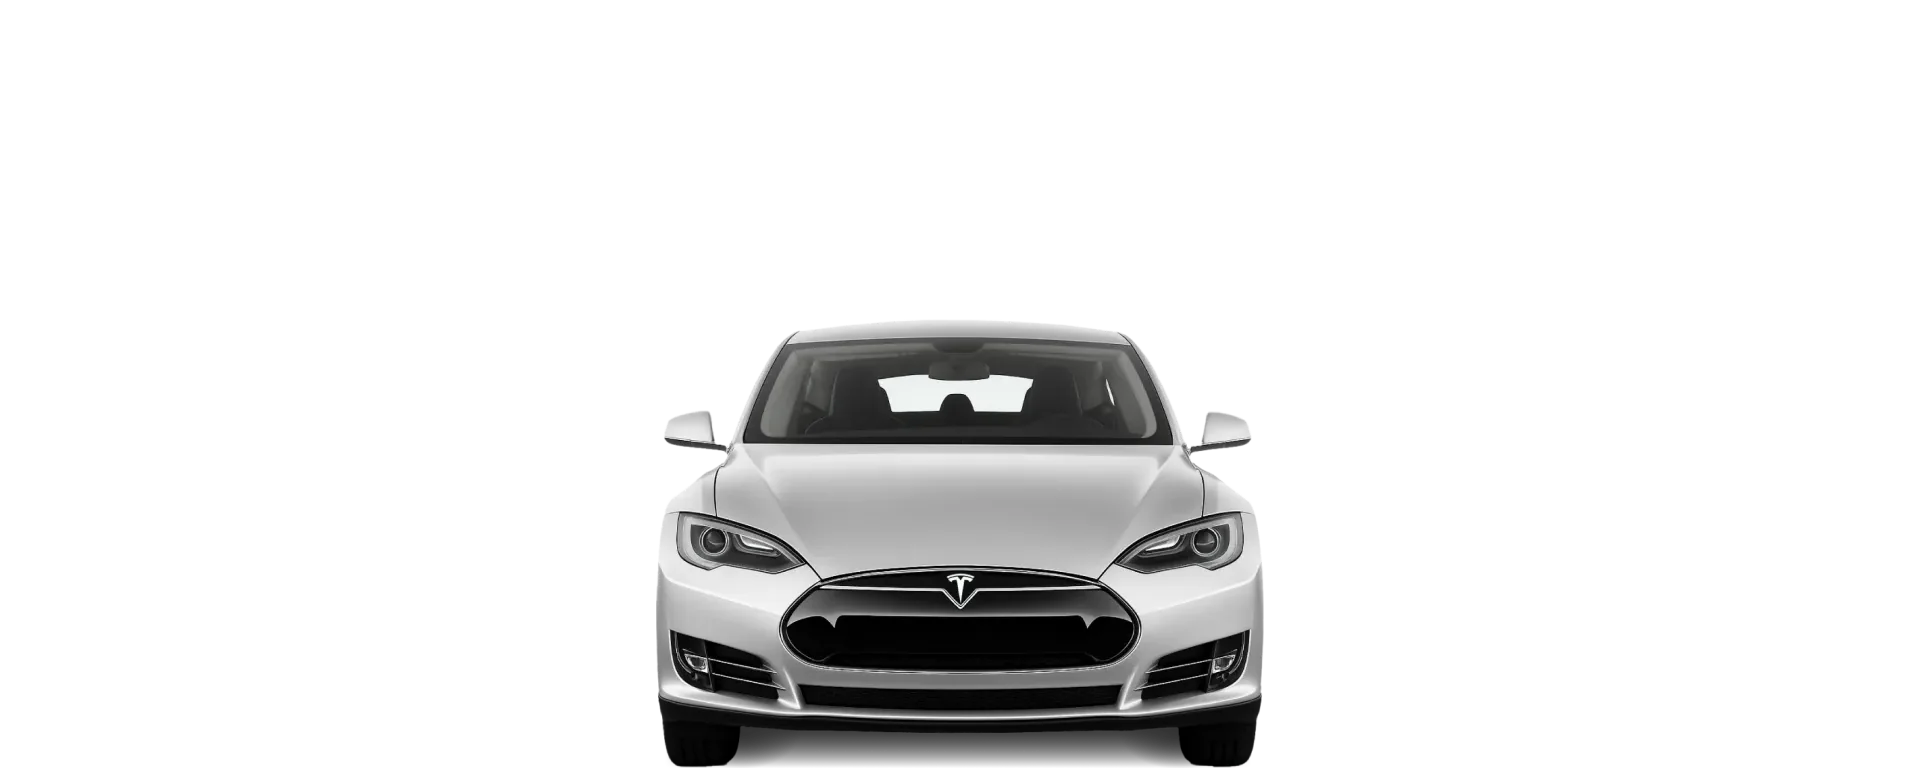
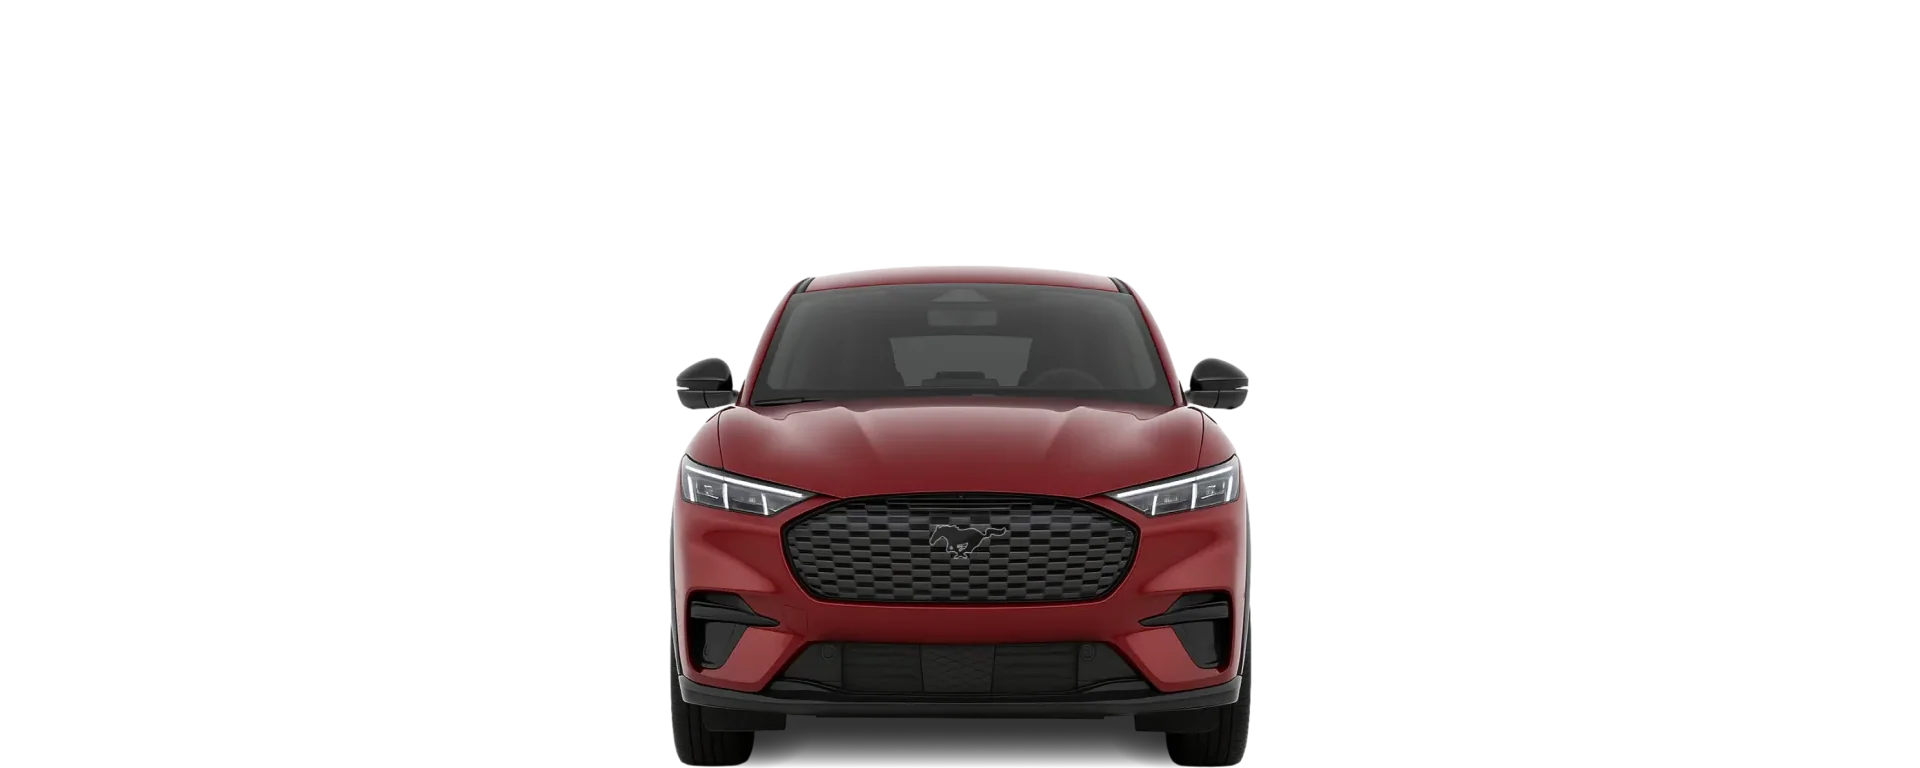
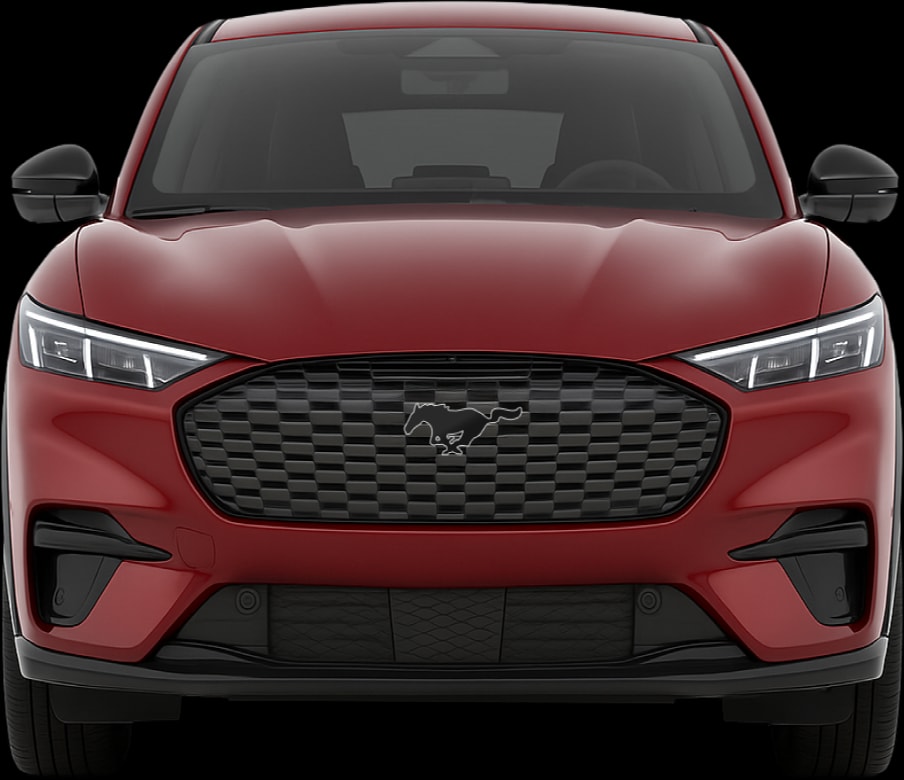
Front view
Cargo Capacity: which has more space?
Standard and largest cargo capacity
Across both cargo volume configurations, the 2021 Ford Mustang Mach‑E is more generous. It has a significant 77 L lead in the boot and a noticeable 44 L (SAE) of additional storage with the seats folded.
Measurements
Standard cargo capacity (VDA)
The standard cargo capacity using VDA, the method commonly used globally.
This is the manufacturer's normal published figure; it does not imply a particular seat configuration.
N/A
402 L
Largest cargo capacity (VDA)
The largest cargo capacity using VDA, the method commonly used globally.
If only one VDA figure is published, the standard and largest values are the same.
N/A
1,420 L
Standard cargo capacity (SAE)
The standard cargo capacity using SAE, the method commonly used in the US.
This is the manufacturer's normal published figure; it does not imply a particular seat configuration.
745 L
822 L (+77)
Largest cargo capacity (SAE)
The largest cargo capacity using SAE, the method commonly used in the US.
If only one SAE figure is published, the standard and largest values are the same.
1,645 L
1,689 L (+44)
Frunk capacity
150 L (+69)
81 L
Cargo space vs length
This DriveSize metric divides blended cargo volume by overall vehicle length.
Blended cargo uses 65% of the standard figure and 35% of the largest figure, using VDA where available and SAE otherwise.
213.3 L per m (+52.4)
160.9 L per m
Cargo space vs footprint
This DriveSize metric divides blended cargo volume by footprint.
Blended cargo uses 65% of the standard figure and 35% of the largest figure, using VDA where available and SAE otherwise.
It helps show how efficiently a car turns exterior area into usable cargo space.
108.6 L per m² (+23.1)
85.5 L per m²
How each car compares with its class average
Standard cargo capacity (VDA)
The standard cargo capacity using VDA, the method commonly used globally.
This is the manufacturer's normal published figure; it does not imply a particular seat configuration.
N/A
402 L
43 L less cargo volume than the average Crossover
Largest cargo capacity (VDA)
The largest cargo capacity using VDA, the method commonly used globally.
If only one VDA figure is published, the standard and largest values are the same.
N/A
1,420 L
88 L less cargo volume than the average Crossover
Standard cargo capacity (SAE)
The standard cargo capacity using SAE, the method commonly used in the US.
This is the manufacturer's normal published figure; it does not imply a particular seat configuration.
745 L
349 L more cargo volume than the average Sedan
822 L
83 L more cargo volume than the average Crossover
Largest cargo capacity (SAE)
The largest cargo capacity using SAE, the method commonly used in the US.
If only one SAE figure is published, the standard and largest values are the same.
1,645 L
Class benchmark unavailable.
1,689 L
182 L less cargo volume than the average Crossover
DriveSize space efficiency
DriveSize space efficiency compares blended cargo volume per square meter of footprint with the class average.
Blended cargo uses 65% of the standard figure and 35% of the largest figure within the selected cargo measurement method.
VDA values compare with VDA class averages, and SAE values compare with SAE class averages. Positive percentages indicate more space efficiency and negative percentages indicate less.
-13%
VDA: Less space efficient than the average Crossover
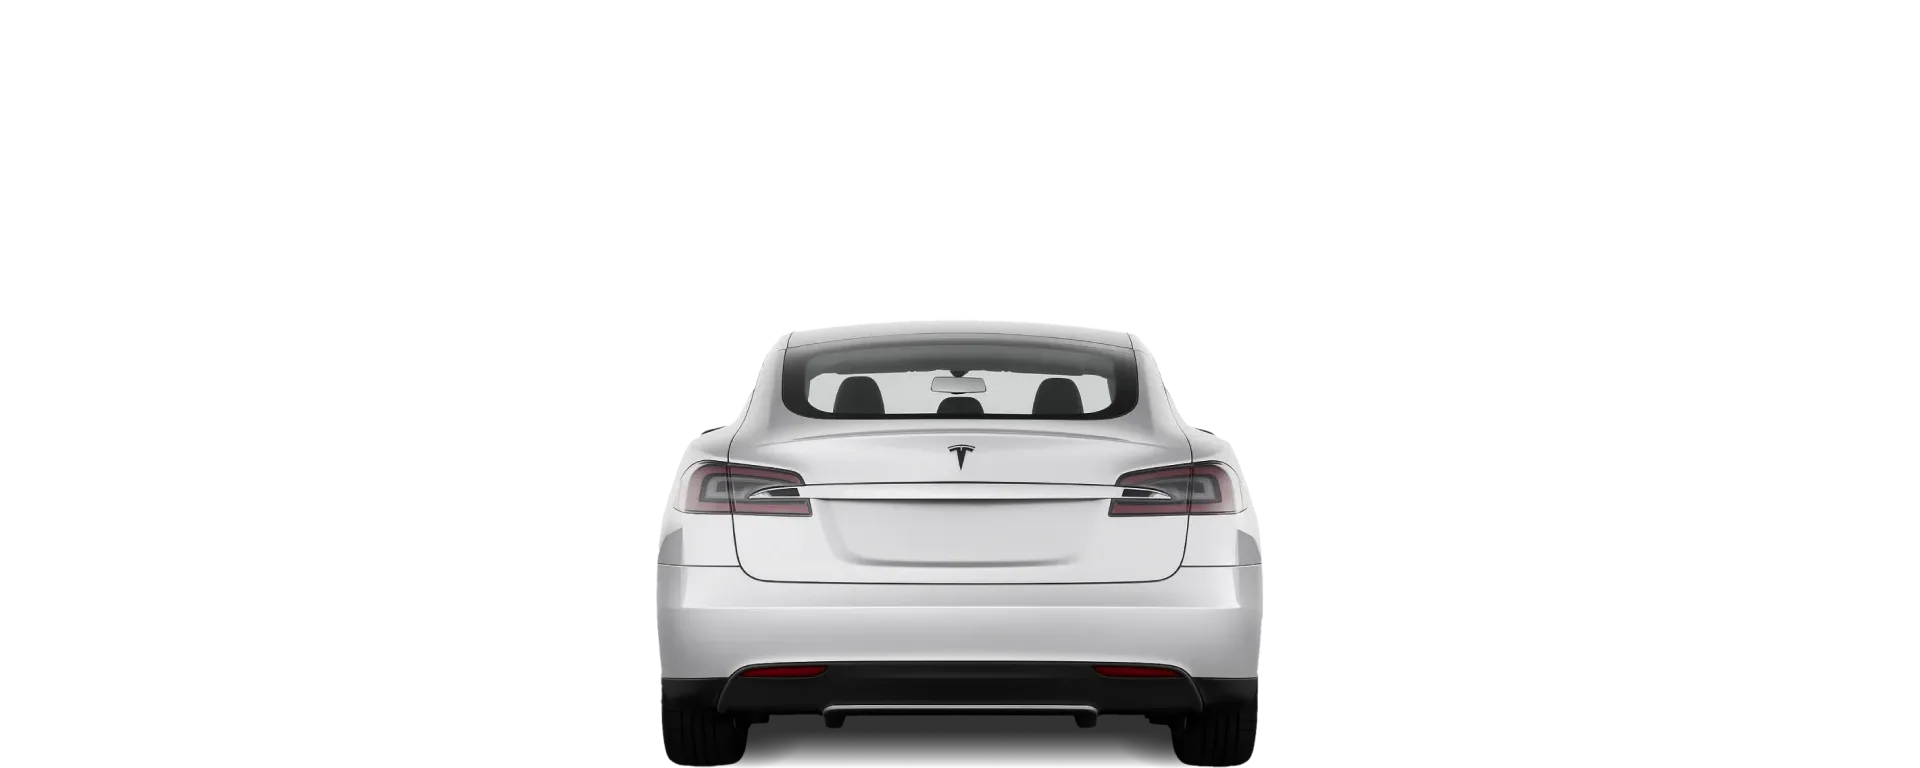
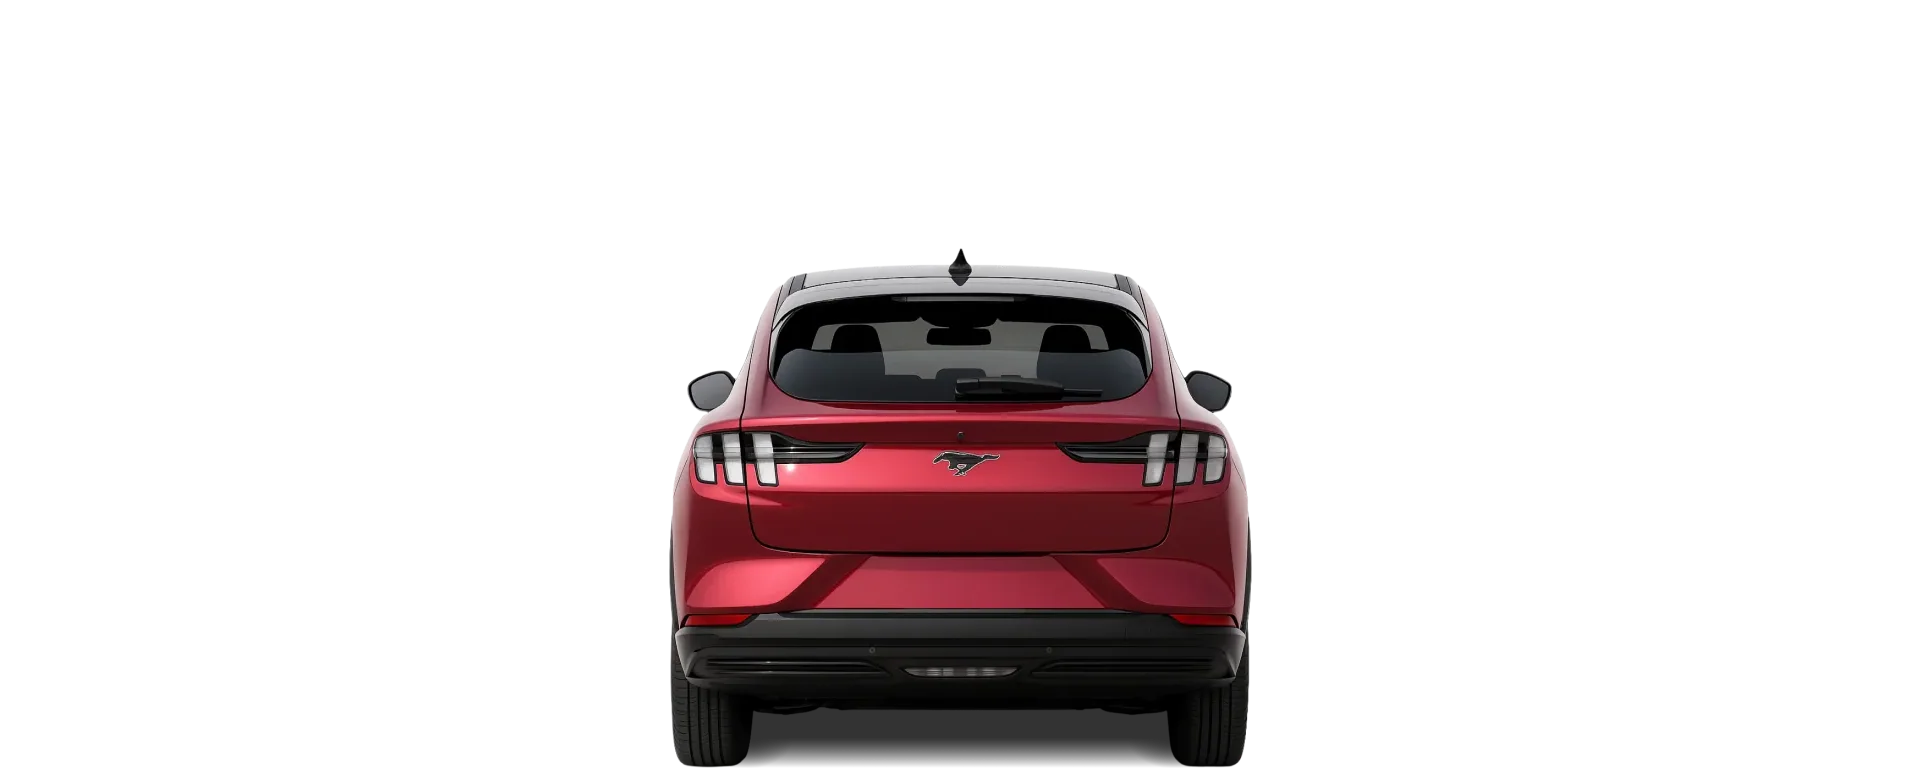
Rear view
Details
Doors, seats, weight, maneuverability
Choosing the 2013 Tesla Model S means managing with 1 fewer door(s), but this usually means a cleaner looking side profile than the 5-door 2021 Ford Mustang Mach‑E. Both the 2021 Ford Mustang Mach‑E and the 2013 Tesla Model S offer seating for 5, meaning they are equally capable when it comes to carrying passengers. The maneuverability is nearly the same, with the 2013 Tesla Model S holding a slim 0.3 m turning circle advantage. The 2013 Tesla Model S and 2021 Ford Mustang Mach‑E are effectively in the same weight bracket, separated by a minor 30 kg.
Measurements
Doors
4
5 (+1)
Max. seats
5
5
Turning circle
11.3 m
11.6 m (+0.3)
Curb weight
1,999 kg (+30)
1,969 kg
How each car compares with its class average
Turning circle
11.3 m
0.2 m larger turning circle than the average Sedan
11.6 m
0.4 m larger turning circle than the average Crossover
Curb weight
1,999 kg
477 kg heavier than the average Sedan
1,969 kg
337 kg heavier than the average Crossover
DriveSize manoeuvrability
DriveSize manoeuvrability combines turning circle and footprint, with turning circle weighted more heavily.
A positive percentage means more manoeuvrable than the class average and a negative percentage means less manoeuvrable.
-5%
Less manoeuvrable than the average Sedan
-4%
Less manoeuvrable than the average Crossover
Parking
Will the 2013 Tesla Model S or 2021 Ford Mustang Mach‑E fit in a standard parking space?
2013 Tesla Model S parking fit score
DriveSize compares the car's width and length with typical parking-space sizes by region.
Vehicle dimensions are rounded up and available side or length clearance is rounded down.
Side clearance is based on body width where available; real spaces can vary because of mirrors, walls, pillars, kerbs, bay markings, and nearby cars.
For an average USA / Canada space: body side clearance is 39 cm per side, and length clearance is 26.5 cm at each end.
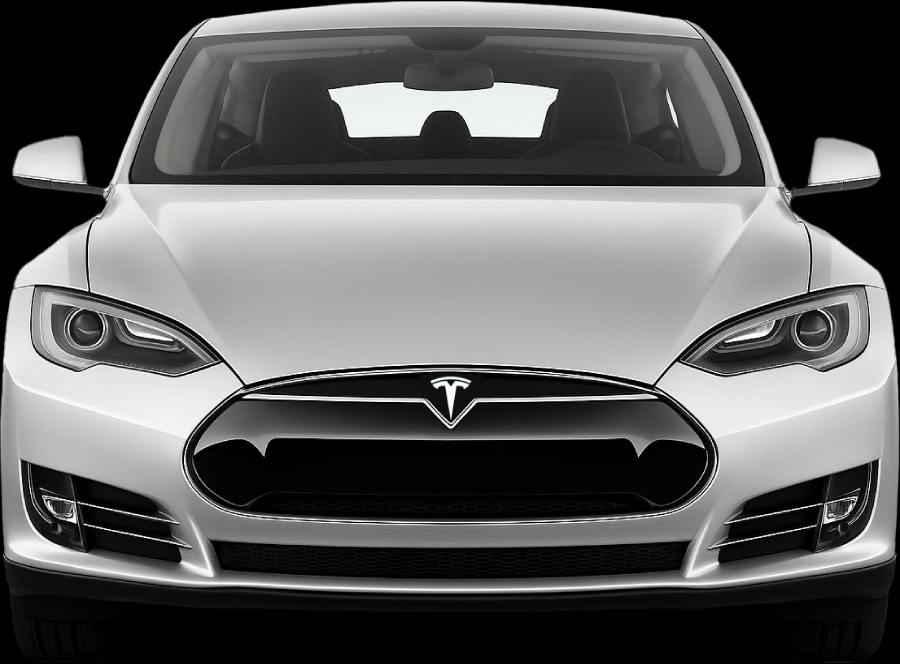
Body side clearance
39 cm
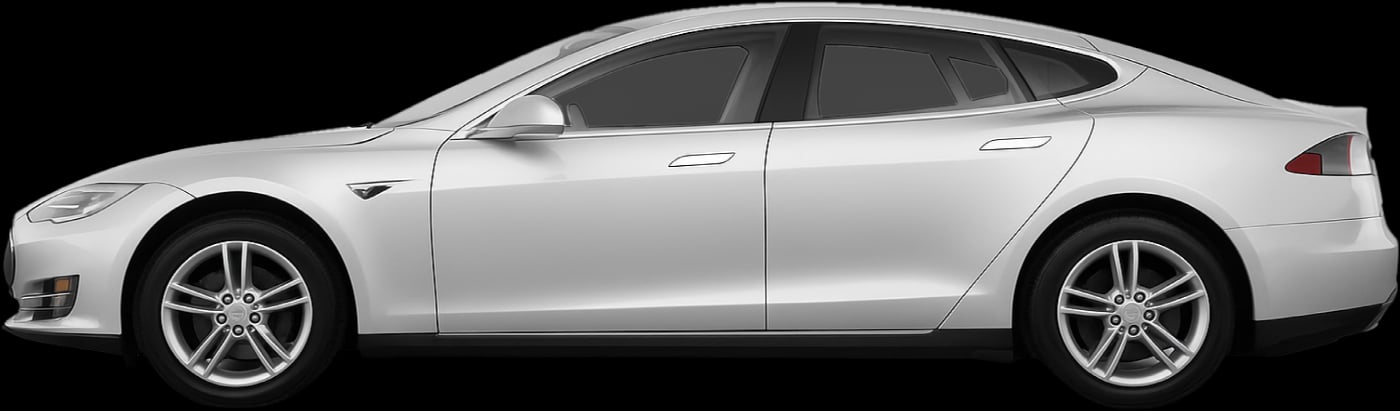
Length clearance (at each end)
26.5 cm
2021 Ford Mustang Mach‑E parking fit score
DriveSize compares the car's width and length with typical parking-space sizes by region.
Vehicle dimensions are rounded up and available side or length clearance is rounded down.
Side clearance is based on body width where available; real spaces can vary because of mirrors, walls, pillars, kerbs, bay markings, and nearby cars.
For an average USA / Canada space: body side clearance is 43 cm per side, and length clearance is 39 cm at each end.
Body side clearance
43 cm
Length clearance (at each end)
39 cm
FAQs
Frequently asked questions
Vehicle specifications on this page are sourced from official Tesla and Ford documentation. Unless the page identifies a specific trim, body style, powertrain or market version, DriveSize uses manufacturer-published specifications for the base model as its default reference. DriveSize standardises the published measurements and calculates the comparisons and derived figures shown. Figures can vary by market, model year, trim, powertrain, wheels, tyres and measurement method. How DriveSize sources and calculates these figures.