
2023 Honda CR‑V vs 2018 Jeep Wrangler Unlimited
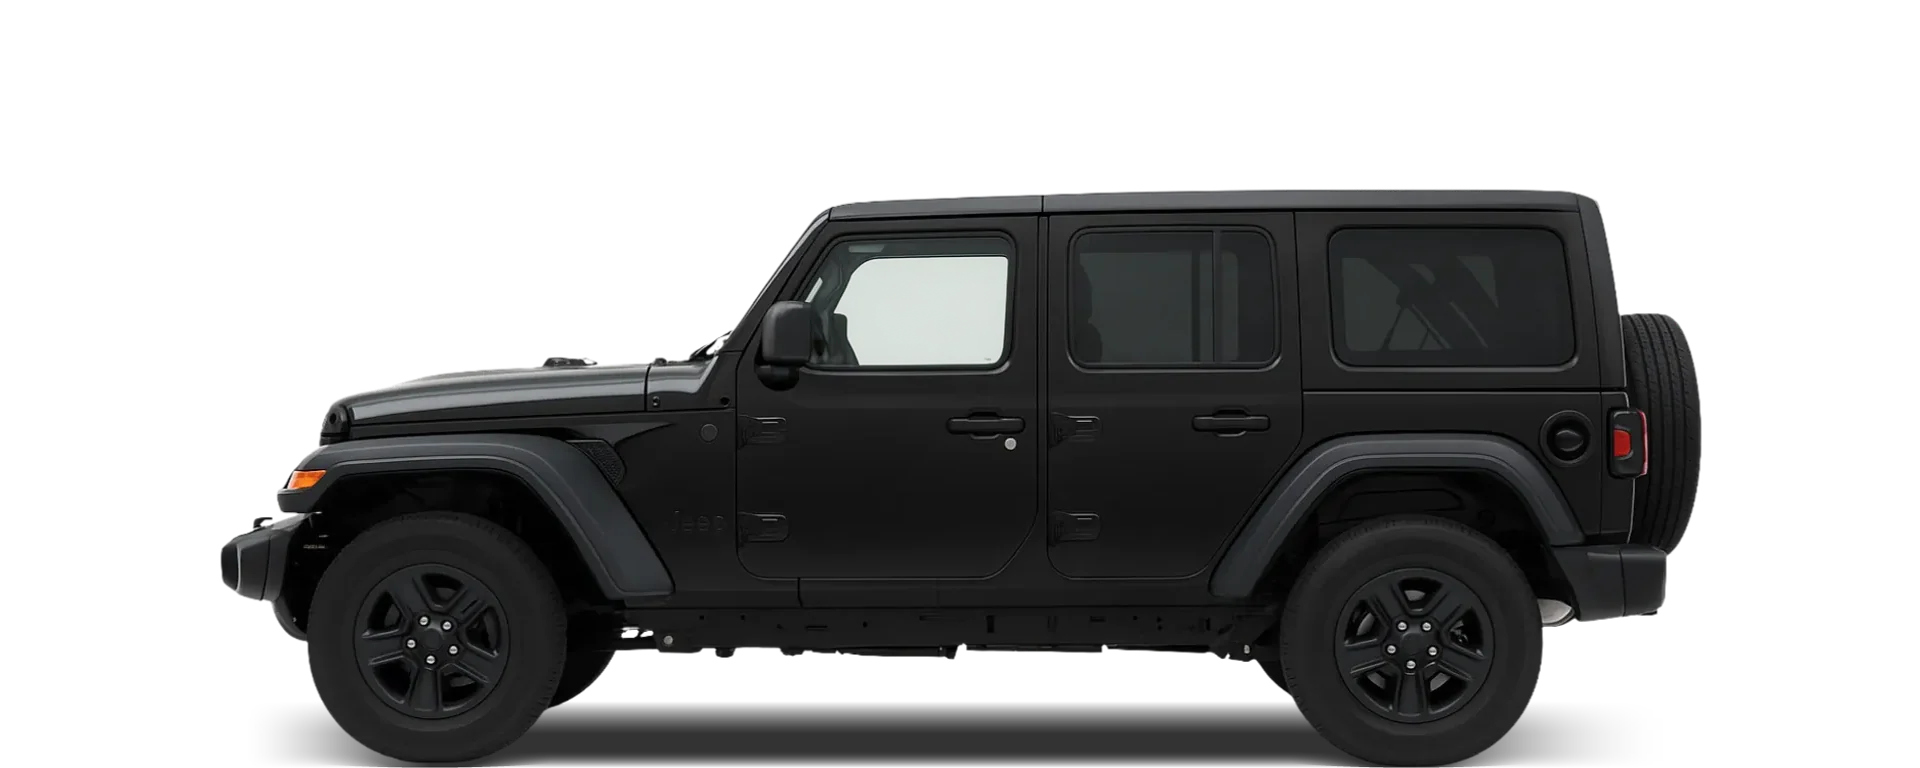
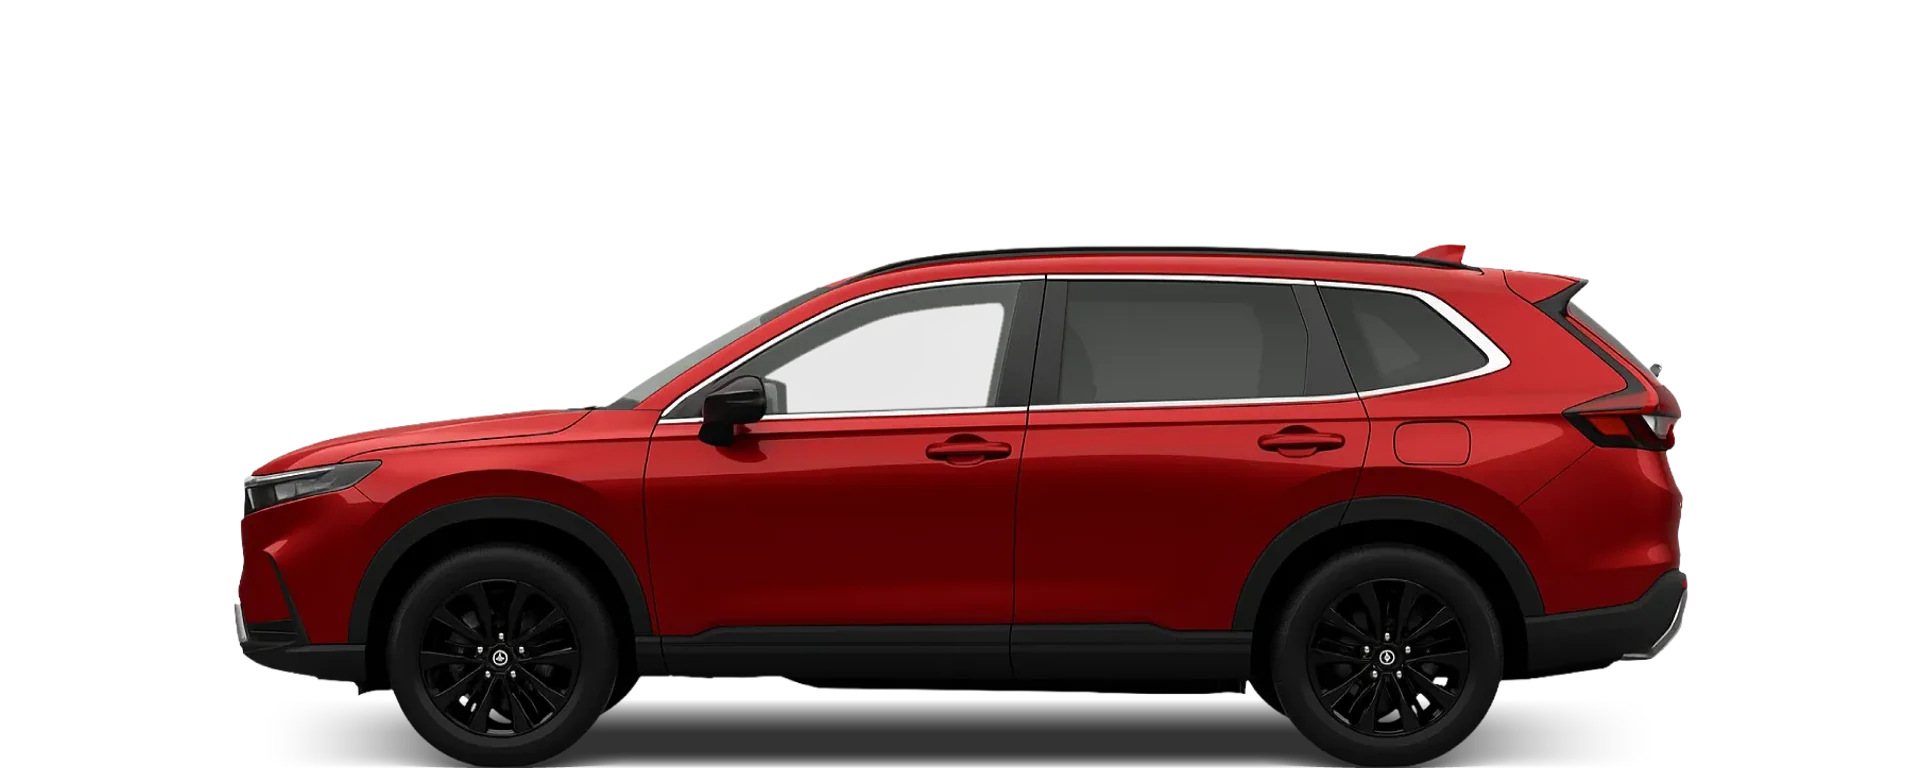
Which is bigger, the 2023 Honda CR‑V or 2018 Jeep Wrangler Unlimited?
Key dimensions: length, width, height
The length difference of just 9.1 cm between these two vehicles is marginal. There’s a marginal 0.8 cm width difference; the 2018 Jeep Wrangler Unlimited is effectively the same width as the 2023 Honda CR‑V for all practical purposes. The height difference is quite significant, with the 2018 Jeep Wrangler Unlimited standing a substantial 18.7 cm taller than the 2023 Honda CR‑V. The extra 4.8 cm of clearance helps the 2018 Jeep Wrangler Unlimited feel a bit more robust in daily driving. The 2018 Jeep Wrangler Unlimited provides a much more settled and secure feel at high speeds compared to the 2023 Honda CR‑V thanks to its 30.8 cm wheelbase advantage.
Measurements
Length
469.4 cm
478.5 cm (+9.1)
Height
168.1 cm
186.8 cm (+18.7)
Body width
186.7 cm
187.5 cm (+0.8)
Ground clearance
19.8 cm
24.6 cm (+4.8)
Wheelbase
270 cm
300.8 cm (+30.8)
Footprint
DriveSize footprint is overall length multiplied by body width.
8.8 m²
9 m² (+0.2)
How each car compares with its class average
Length
469.4 cm
16.8 cm longer than the average Crossover
478.5 cm
16.9 cm shorter than the average SUV
Height
168.1 cm
5.3 cm taller than the average Crossover
186.8 cm
3.3 cm shorter than the average SUV
Body width
186.7 cm
1.8 cm wider than the average Crossover
187.5 cm
8.2 cm narrower than the average SUV
Ground clearance
19.8 cm
1.7 cm more ground clearance than the average Crossover
24.6 cm
2.1 cm more ground clearance than the average SUV
Wheelbase
270 cm
2.4 cm shorter wheelbase than the average Crossover
300.8 cm
10.7 cm longer wheelbase than the average SUV
Footprint
DriveSize footprint is overall length multiplied by body width.
8.8 m²
0.4 m² larger footprint than the average Crossover
9 m²
0.8 m² smaller footprint than the average SUV
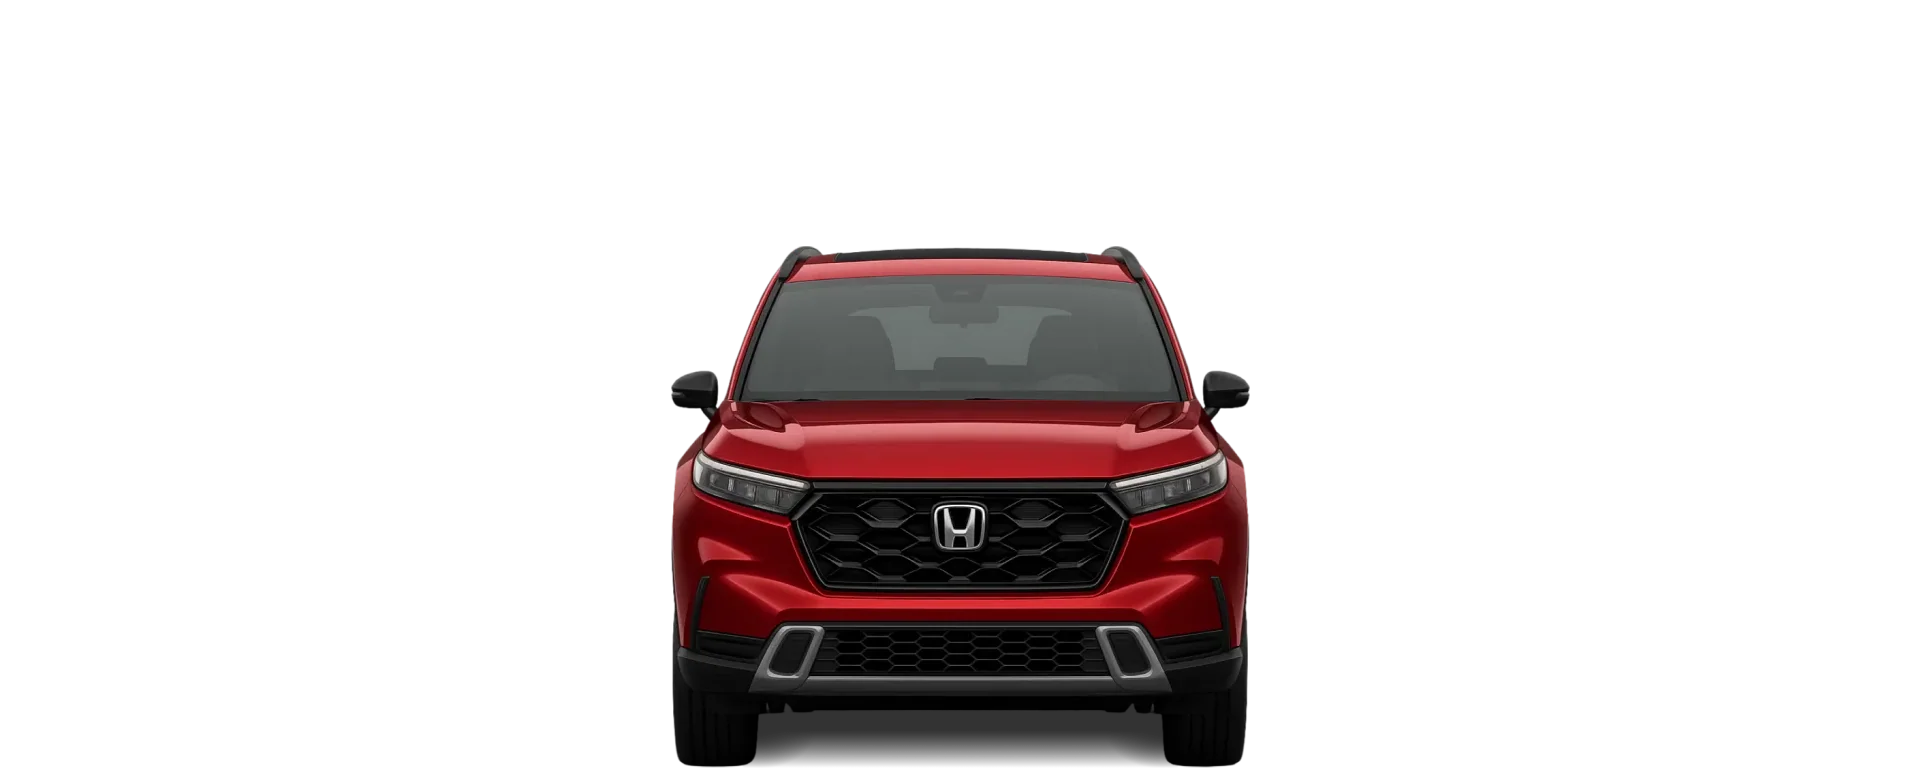
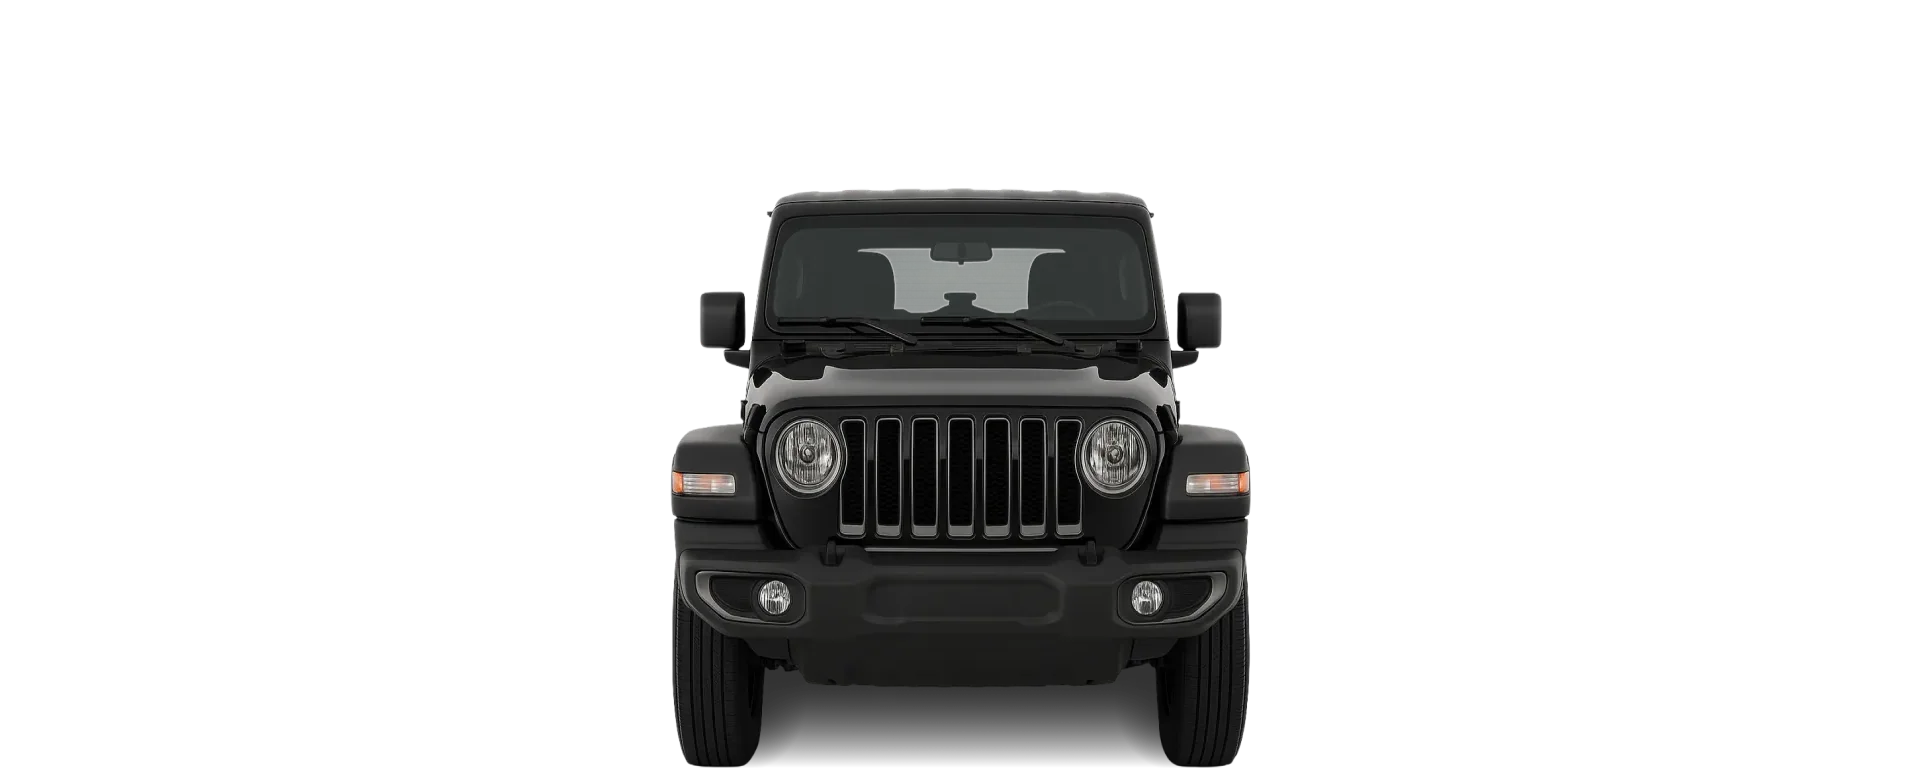
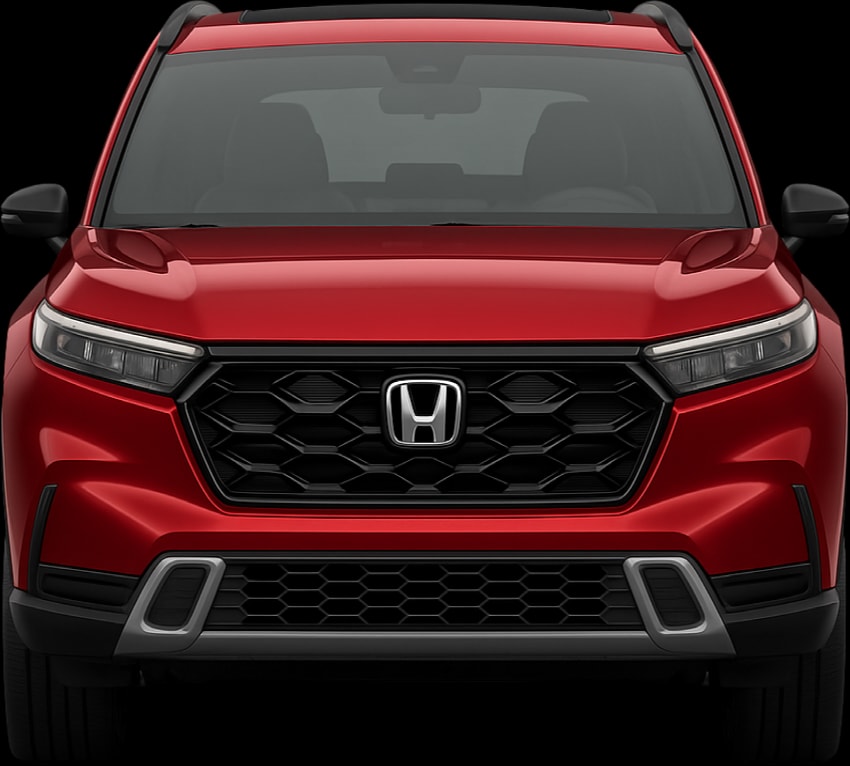
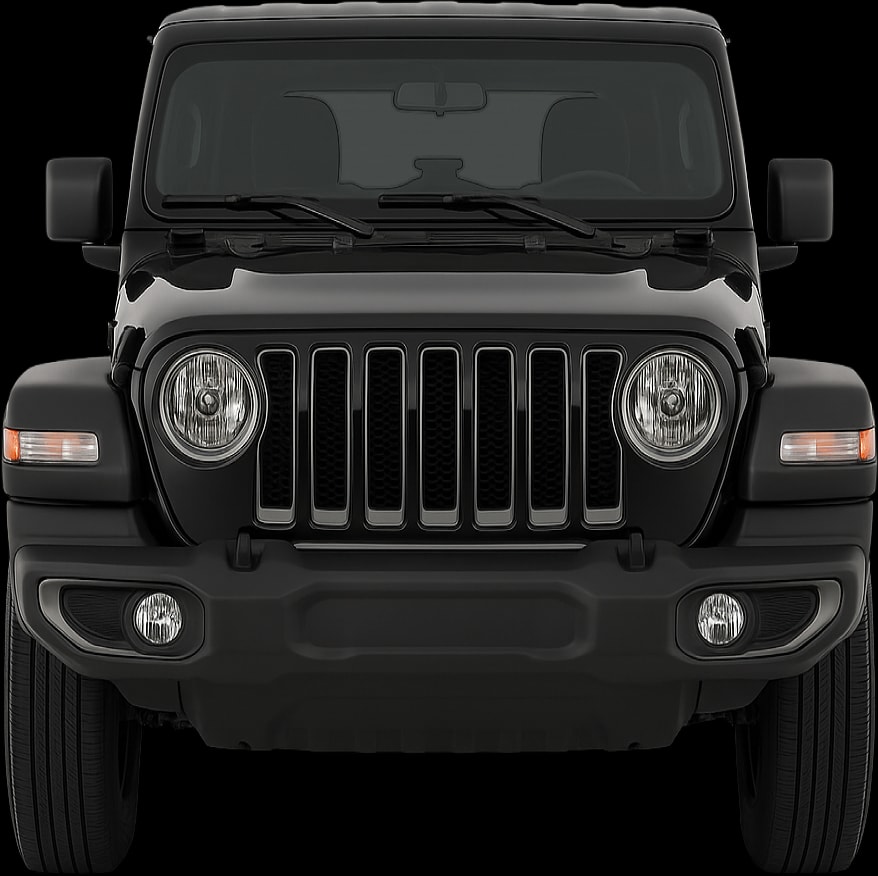
Front view
Cargo Capacity: which has more space?
Standard and largest cargo capacity
The 2023 Honda CR‑V takes the lead in both seating states, providing an extra 215 L for your luggage with the seats up and a small 116 L (SAE) more with them down.
Measurements
Standard cargo capacity (SAE)
The standard cargo capacity using SAE, the method commonly used in the US.
This is the manufacturer's normal published figure; it does not imply a particular seat configuration.
1,113 L (+215)
898 L
Largest cargo capacity (SAE)
The largest cargo capacity using SAE, the method commonly used in the US.
If only one SAE figure is published, the standard and largest values are the same.
2,166 L (+116)
2,050 L
Cargo space vs length
This DriveSize metric divides blended cargo volume by overall vehicle length.
Blended cargo uses 65% of the standard figure and 35% of the largest figure, using VDA where available and SAE otherwise.
315.6 L per m (+43.7)
271.9 L per m
Cargo space vs footprint
This DriveSize metric divides blended cargo volume by footprint.
Blended cargo uses 65% of the standard figure and 35% of the largest figure, using VDA where available and SAE otherwise.
It helps show how efficiently a car turns exterior area into usable cargo space.
169.1 L per m² (+24.1)
145 L per m²
How each car compares with its class average
Standard cargo capacity (SAE)
The standard cargo capacity using SAE, the method commonly used in the US.
This is the manufacturer's normal published figure; it does not imply a particular seat configuration.
1,113 L
374 L more cargo volume than the average Crossover
898 L
143 L more cargo volume than the average SUV
Largest cargo capacity (SAE)
The largest cargo capacity using SAE, the method commonly used in the US.
If only one SAE figure is published, the standard and largest values are the same.
2,166 L
295 L more cargo volume than the average Crossover
2,050 L
688 L less cargo volume than the average SUV
DriveSize space efficiency
DriveSize space efficiency compares blended cargo volume per square meter of footprint with the class average.
Blended cargo uses 65% of the standard figure and 35% of the largest figure within the selected cargo measurement method.
VDA values compare with VDA class averages, and SAE values compare with SAE class averages. Positive percentages indicate more space efficiency and negative percentages indicate less.
+29%
SAE: More space efficient than the average Crossover
+5%
SAE: More space efficient than the average SUV
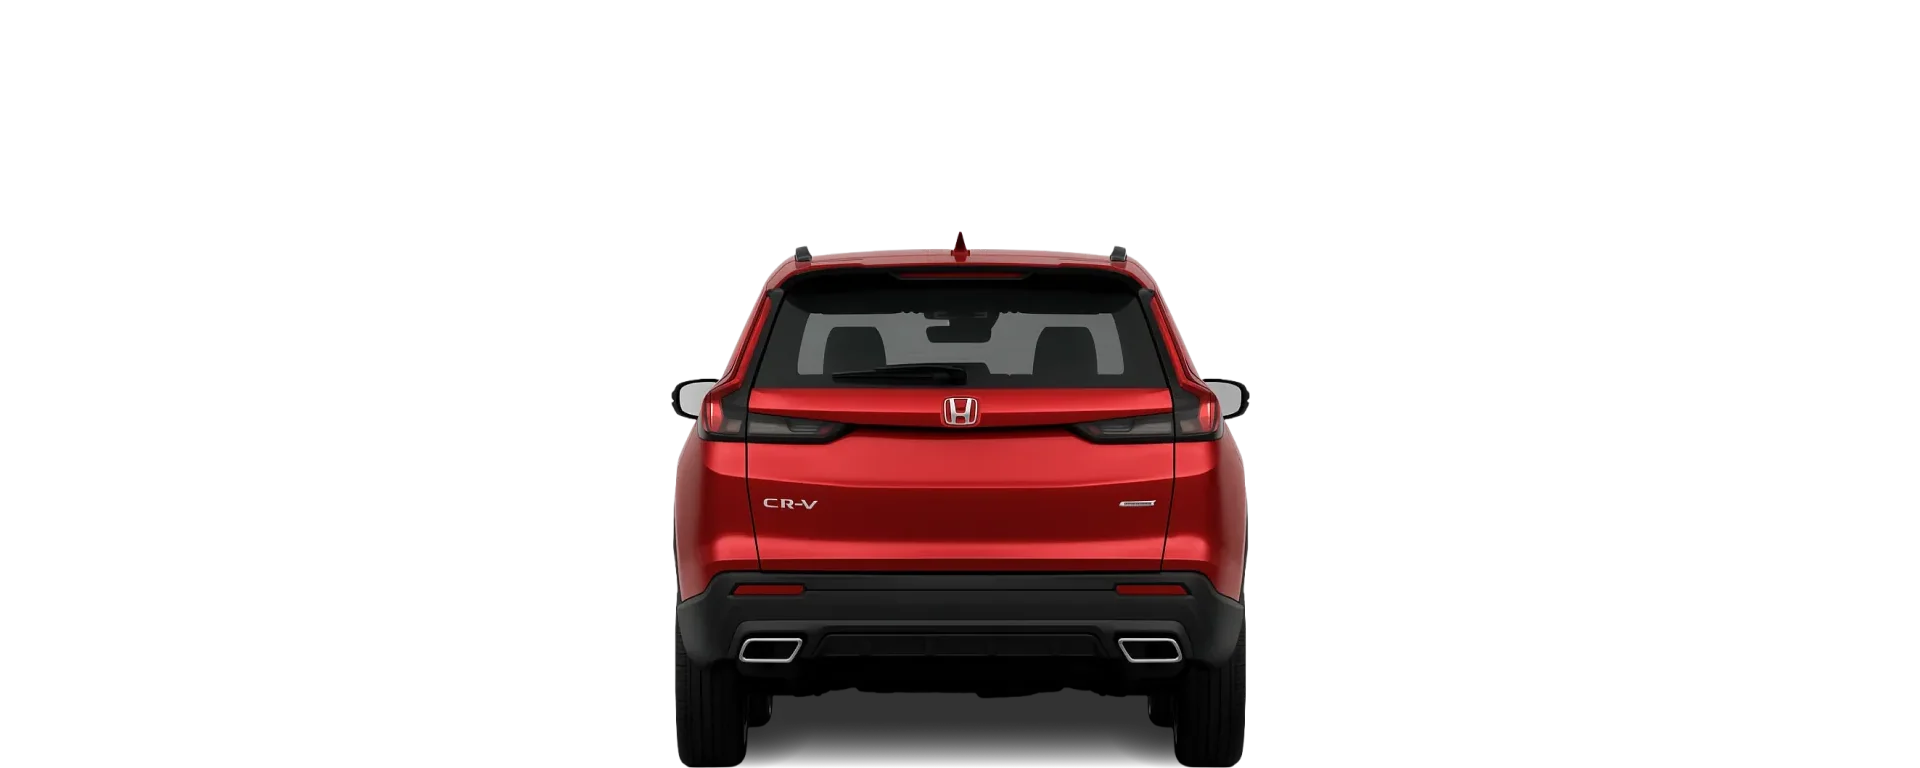
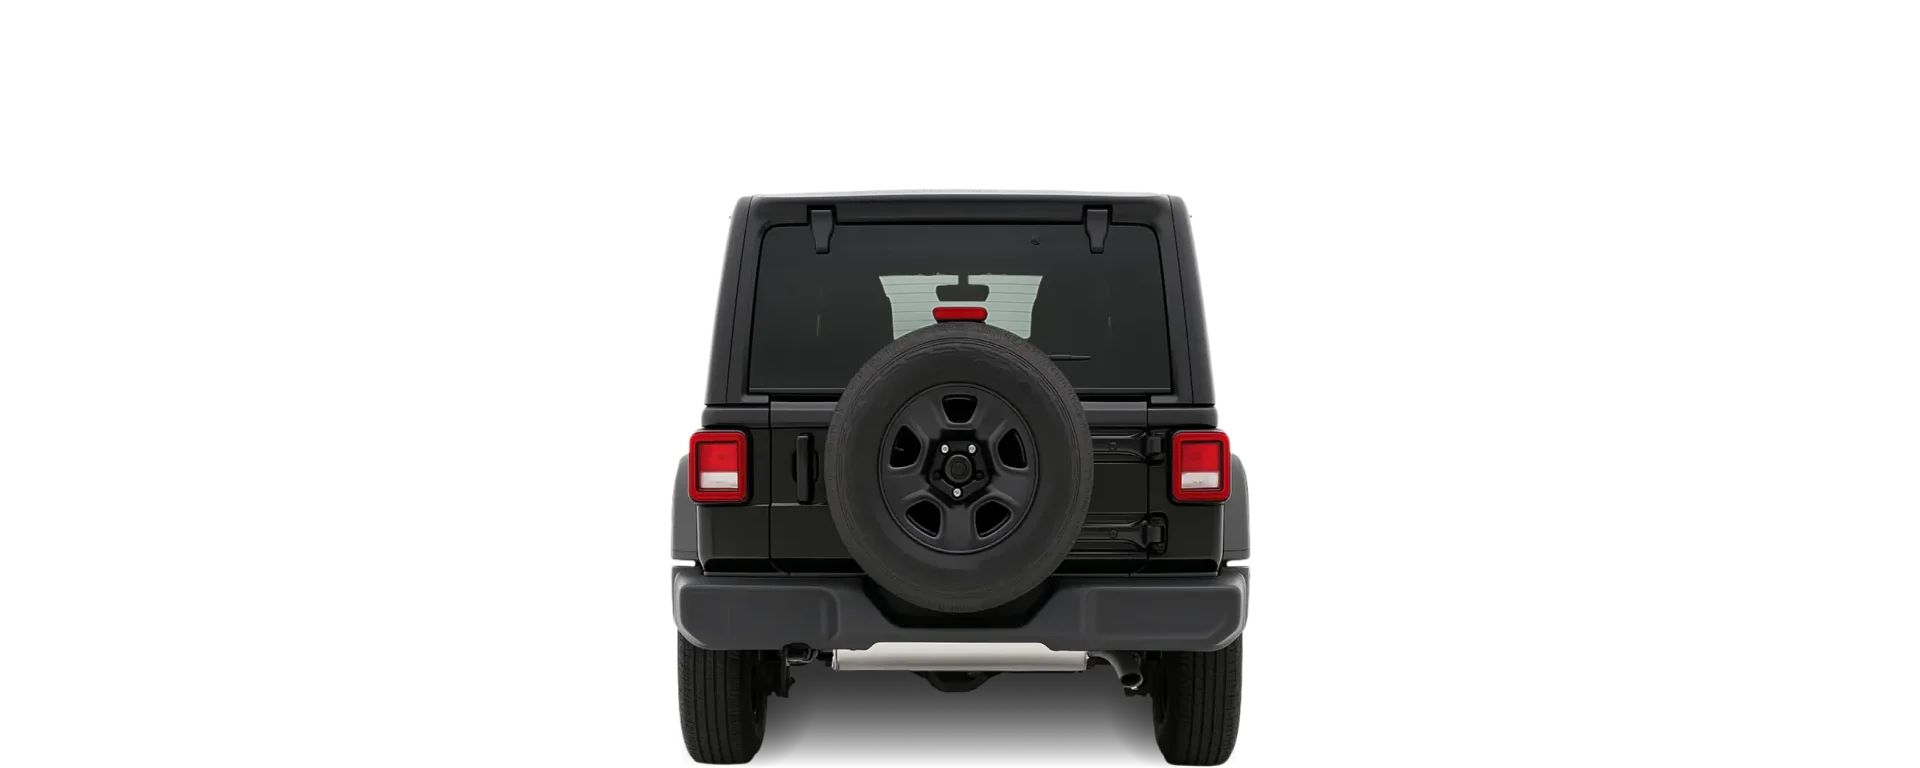
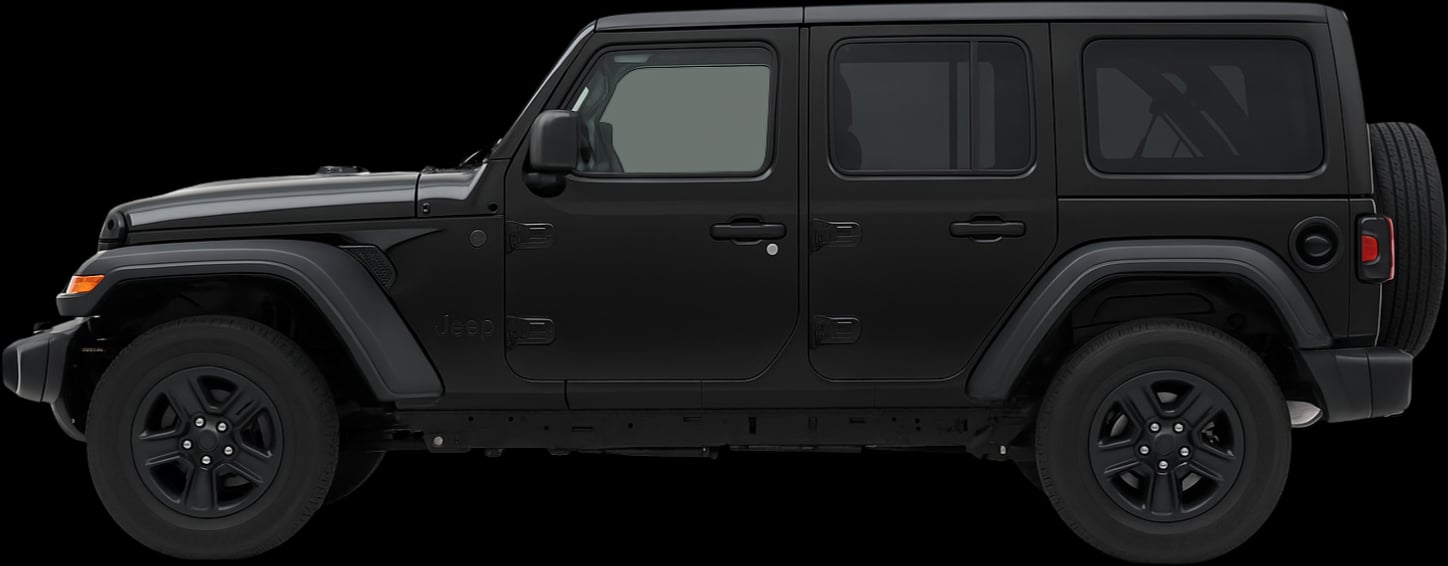
Rear view
Details
Doors, seats, weight, maneuverability
The 2018 Jeep Wrangler Unlimited trades the extra access points of the 2023 Honda CR‑V for a more cohesive and solid body design with just 4 doors. There is no advantage for either model when it comes to passenger numbers, since both offer a 5-seat configuration. You’ll appreciate the 0.6 m tighter turning circle of the 2023 Honda CR‑V when navigating cramped multi-storey car parks. At 337 kg heavier, the 2018 Jeep Wrangler Unlimited sits in a very different weight class to the 2023 Honda CR‑V, something that can have a noticeable impact on performance, economy, and wear on consumables.
Measurements
Doors
5 (+1)
4
Max. seats
5
5
Turning circle
11.4 m
12 m (+0.6)
Curb weight
1,575 kg
1,912 kg (+337)
How each car compares with its class average
Turning circle
11.4 m
0.1 m larger turning circle than the average Crossover
12 m
0 m larger turning circle than the average SUV
Curb weight
1,575 kg
57 kg lighter than the average Crossover
1,912 kg
535 kg lighter than the average SUV
DriveSize manoeuvrability
DriveSize manoeuvrability combines turning circle and footprint, with turning circle weighted more heavily.
A positive percentage means more manoeuvrable than the class average and a negative percentage means less manoeuvrable.
-2%
Less manoeuvrable than the average Crossover
+1%
More manoeuvrable than the average SUV
Parking
Will the 2023 Honda CR‑V or 2018 Jeep Wrangler Unlimited fit in a standard parking space?
2023 Honda CR‑V parking fit score
DriveSize compares the car's width and length with typical parking-space sizes by region.
Vehicle dimensions are rounded up and available side or length clearance is rounded down.
Side clearance is based on body width where available; real spaces can vary because of mirrors, walls, pillars, kerbs, bay markings, and nearby cars.
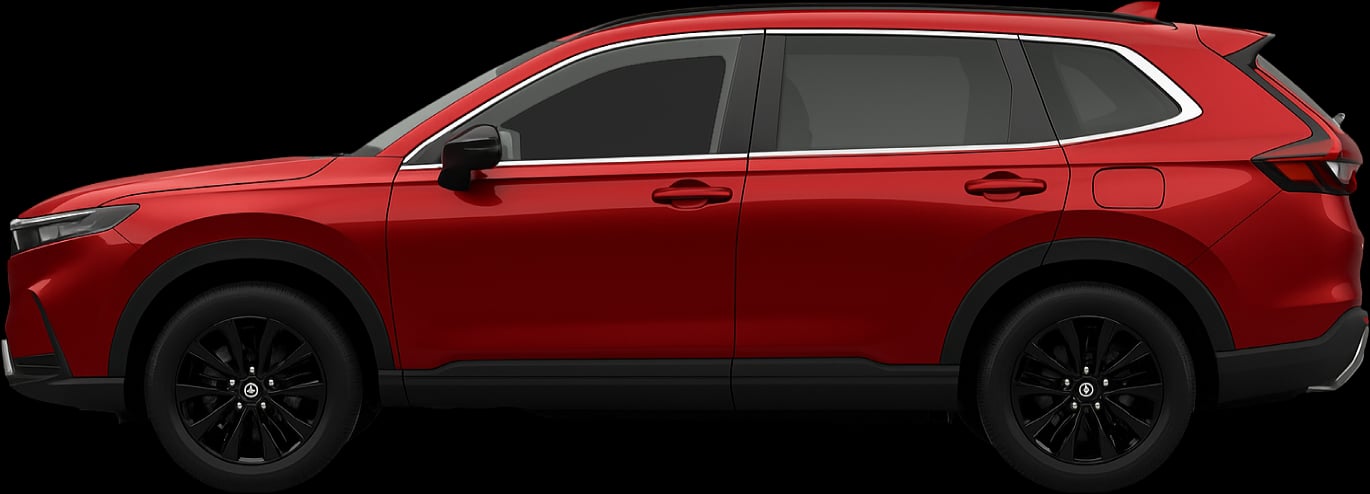
For an average USA / Canada space: body side clearance is 44 cm per side, and length clearance is 40 cm at each end.
Body side clearance
44 cm
Length clearance (at each end)
40 cm
2018 Jeep Wrangler Unlimited parking fit score
DriveSize compares the car's width and length with typical parking-space sizes by region.
Vehicle dimensions are rounded up and available side or length clearance is rounded down.
Side clearance is based on body width where available; real spaces can vary because of mirrors, walls, pillars, kerbs, bay markings, and nearby cars.
For an average USA / Canada space: body side clearance is 43.5 cm per side, and length clearance is 35.5 cm at each end.
Body side clearance
43.5 cm
Length clearance (at each end)
35.5 cm
Articles featuring these cars
View all
What Is Wheelbase? Car Wheelbase Meaning & Why It Matters
Learn what wheelbase means, how it affects ride comfort, handling, turning circle and interior space, and why it matters when choosing your next car.
Will Your Car Fit in a Standard Parking Space? Parking Space Sizes Explained
Find out if your car will fit in a standard parking space. Compare UK, US and international parking bay sizes, and check real vehicle fit with DriveSize.
Boot Space Explained: VDA vs SAE, Seats-Up vs Seats-Down & Real-World Usability
VDA vs SAE boot space explained clearly. Seats-up vs seats-down, litres vs cu.ft, and real examples using the RAV4 & CR-V. The best guide there is.
Compact SUV Size & Boot Space Guide: RAV4 vs CR-V vs Tiguan vs Kona vs Equinox
Compare compact SUV dimensions and boot space for the RAV4, CR-V, Tiguan, Kona and Equinox.
Smallest Car vs the Giants: Peel P50 vs Cybertruck, F-150, Land Cruiser, Palisade & Wrangler
How tiny is the Peel P50 really? See it compared with giants like the Cybertruck, F-150, Land Cruiser, Palisade and Wrangler using real dimensions.
Car width explained: Body width, width with mirrors folded & width including mirrors (with real examples)
Car width made simple: body width, width with mirrors folded and width including mirrors, with real examples from the Model Y, CR-V, Puma, Cybertruck and more.
Tesla Model Y vs Honda CR-V: Width, Height, Boot Space & Real-World Fit
Tesla Model Y vs Honda CR-V compared by width, height, boot space and real-world fit. Clear metric + imperial dimensions to help you choose the right SUV.
What Is Ground Clearance? Why does it matter for SUVs, and which have the most
Clear explanation of SUV ground clearance, how much you really need, and which SUVs offer the most — using real measurements you can compare side-by-side on Drivesize.
Are modern SUVs too big for UK parking bays? We measured popular models (and what still fits)
SUV sizes keep growing — we compared six popular models against a standard UK parking bay using each vehicle’s width including mirrors and overall length.
Toyota RAV4 vs Honda CR-V: Size, Space, Boot Volume & Ground Clearance
See how the Toyota RAV4 and Honda CR-V compare on size, space, and ground clearance. Full dimensions, boot capacities, and real-world usability tested side-by-side – find out which family SUV fits your life best.
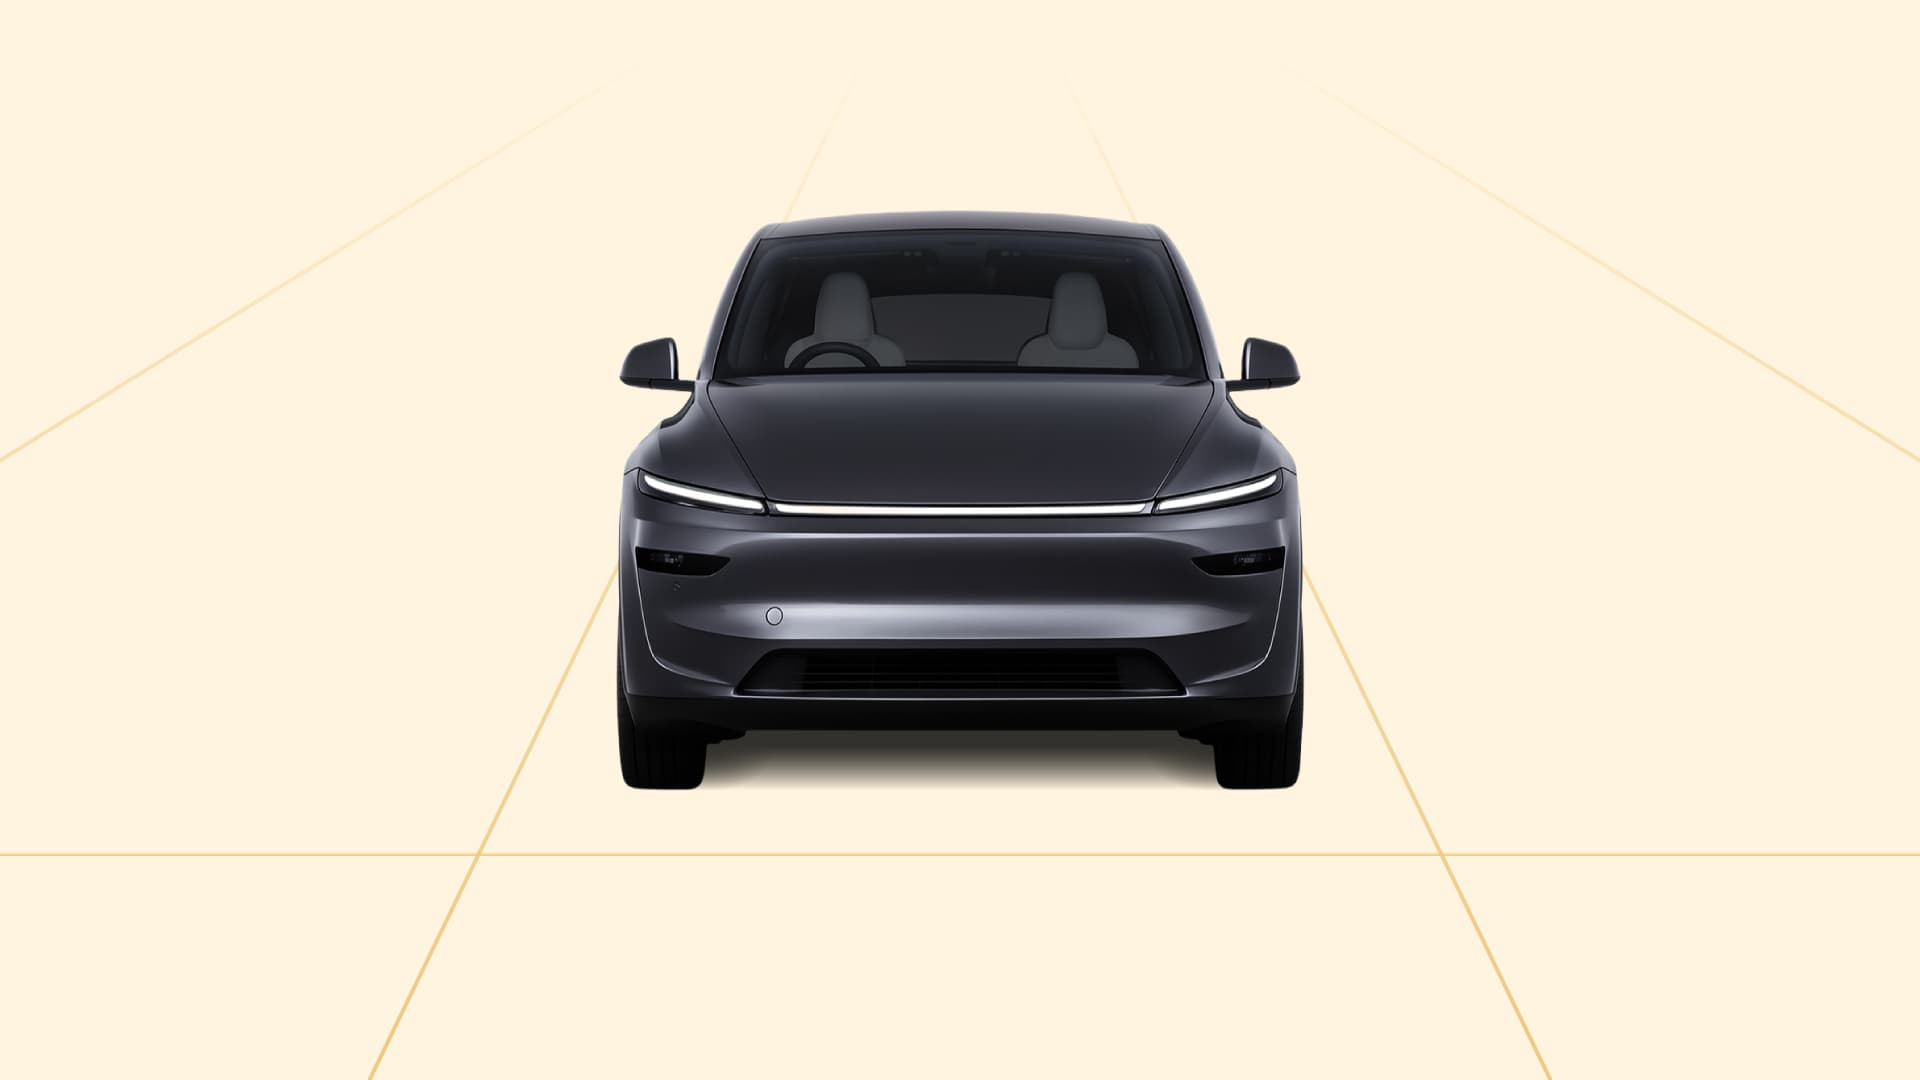
Tesla Model Y Dimensions & Boot Space: Will It Fit a UK Driveway, Garage or Parking Bay?
See how the Tesla Model Y fits UK driveways, garages and parking bays. Full dimensions, width, and boot space explained in real-world terms by Drivesize.
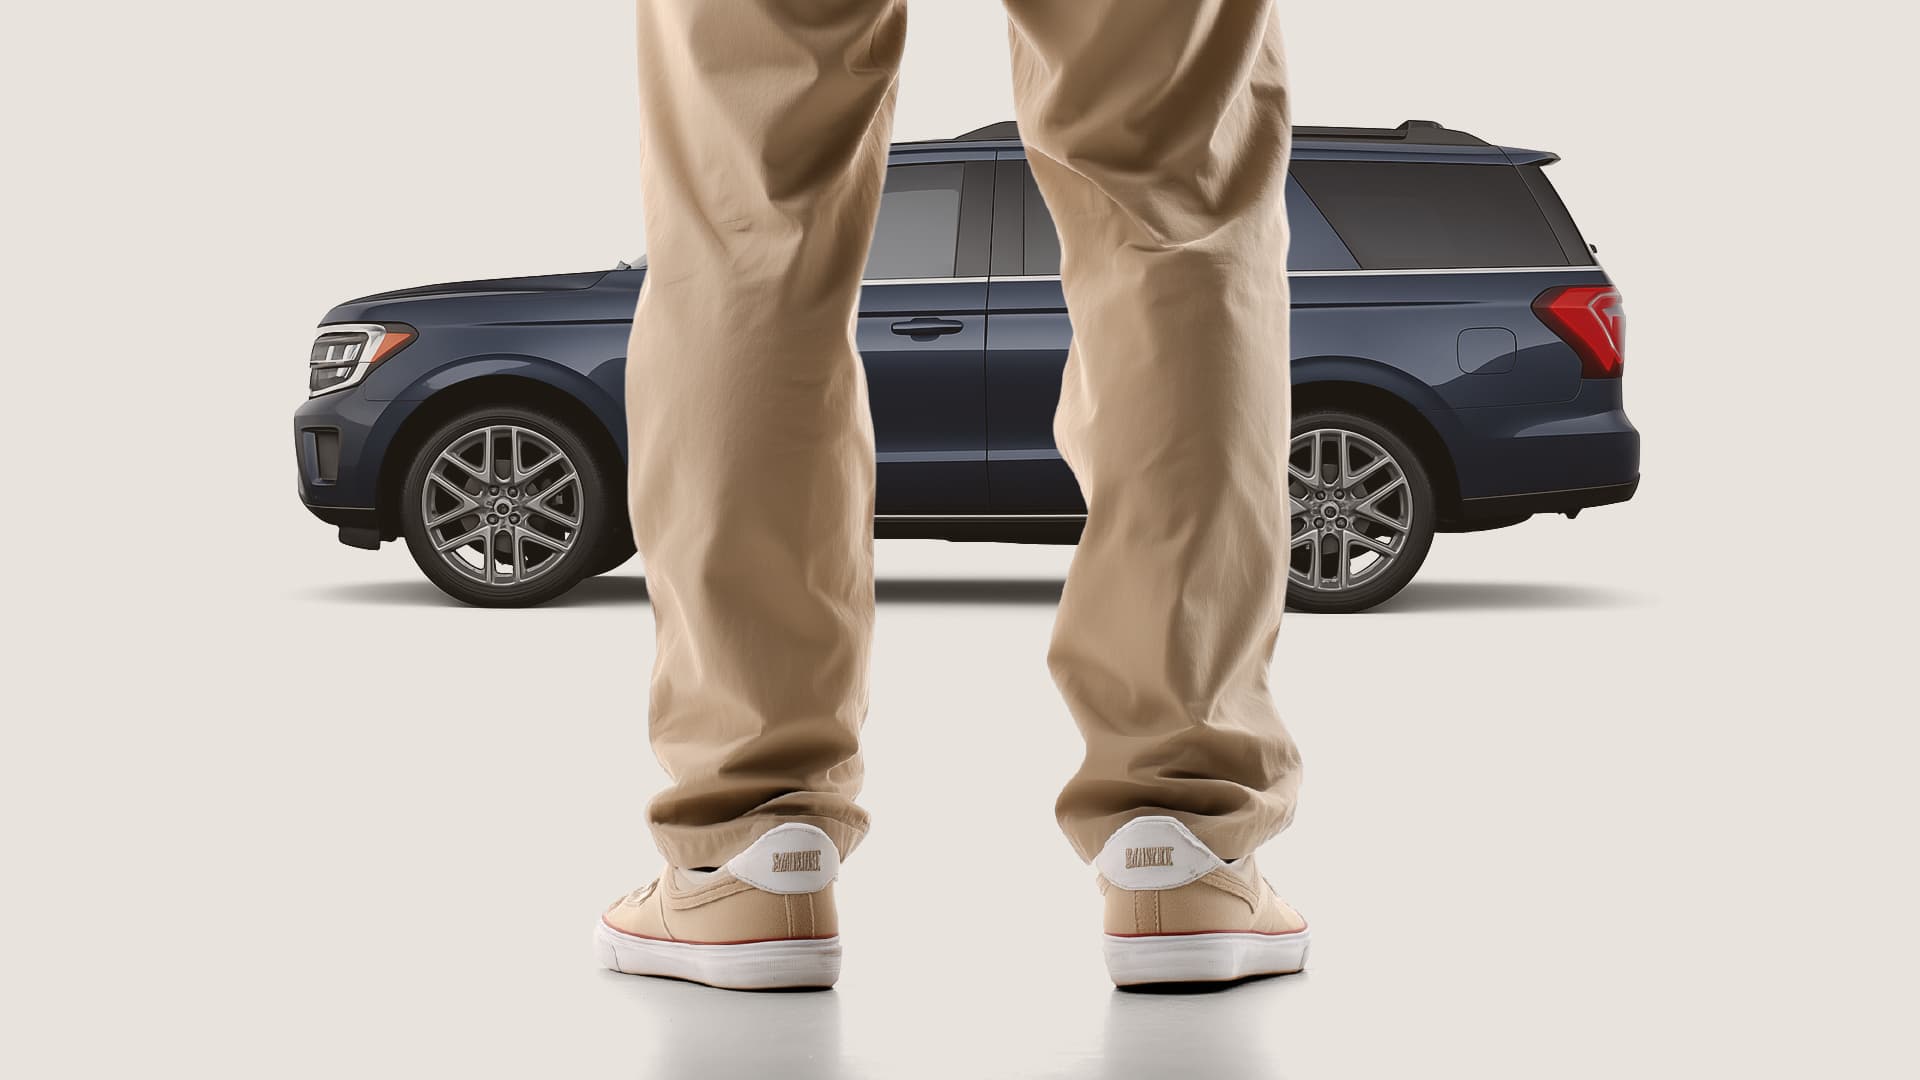
Best Cars for Tall Drivers in the USA (2025, with Real Interior Stats)
Find the most spacious SUVs and sedans for tall drivers in 2025, with real headroom and legroom stats plus setup tips for long-legged comfort.
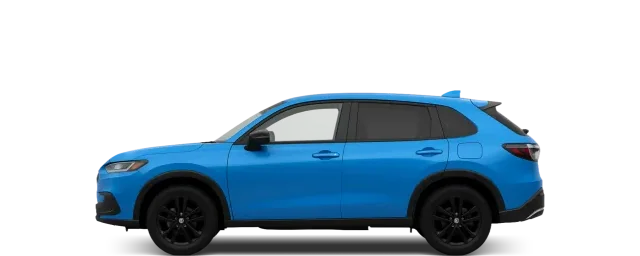
More Hondas
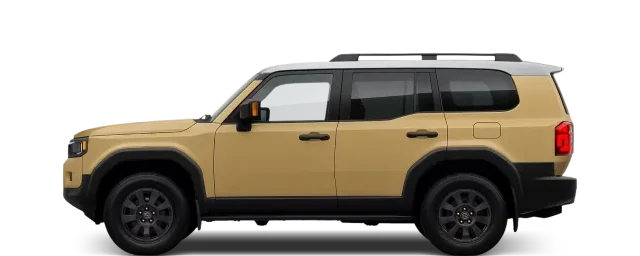
More Jeeps
FAQs
Frequently asked questions
Vehicle specifications on this page are sourced from official Honda and Jeep documentation. Unless the page identifies a specific trim, body style, powertrain or market version, DriveSize uses manufacturer-published specifications for the base model as its default reference. DriveSize standardises the published measurements and calculates the comparisons and derived figures shown. Figures can vary by market, model year, trim, powertrain, wheels, tyres and measurement method. How DriveSize sources and calculates these figures.